
Debugging tools allow you to peek behind the curtain of a website. The tools we are going to look at not only allow you to see and fix issues with your own site, but also act as an educational tool to show you what is happening behind the scenes of your competitors’ sites.

Dev Console
The developer console is an excellent source of information which you will continue to benefit from as you gain more knowledge.
Some set-up tips / tricks:
- Open the console: Open the developer console by clicking the three dots at the top right of your browser and selecting More tools then Developer tools from the dropdown menus. Alternatively, the keyboard shortcut for opening the dev console is CTRL+SHIFT+i (Windows), or you can hit F12.
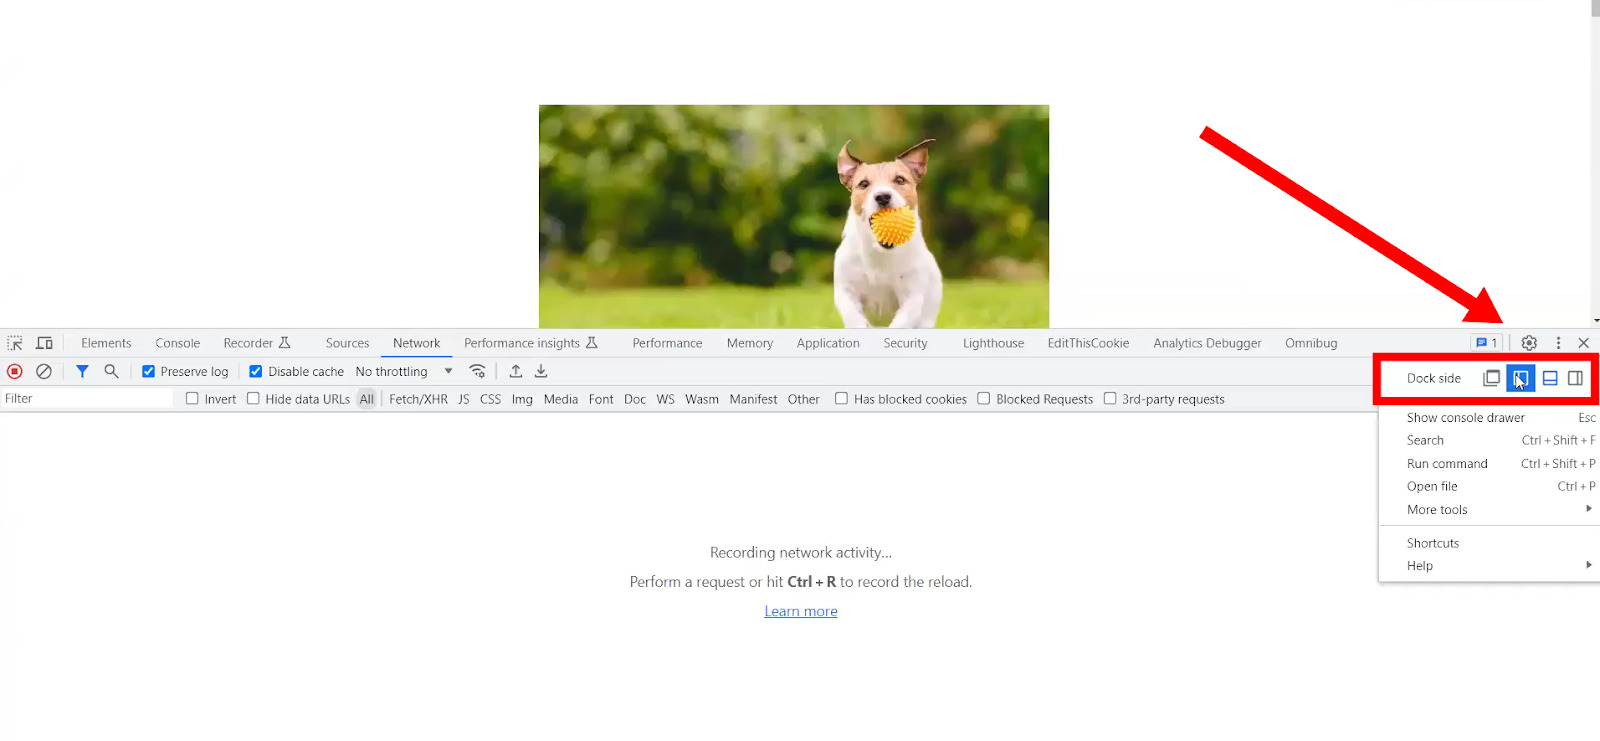
- Choose the placement: The console will usually open horizontally at the bottom of your screen but you can change its placement as needed. Click the three dots at the top right of the console to open a dropdown menu and choose from the Dock side options. If you are using an additional monitor, you can open the console in a separate window, giving you even more space to work with.
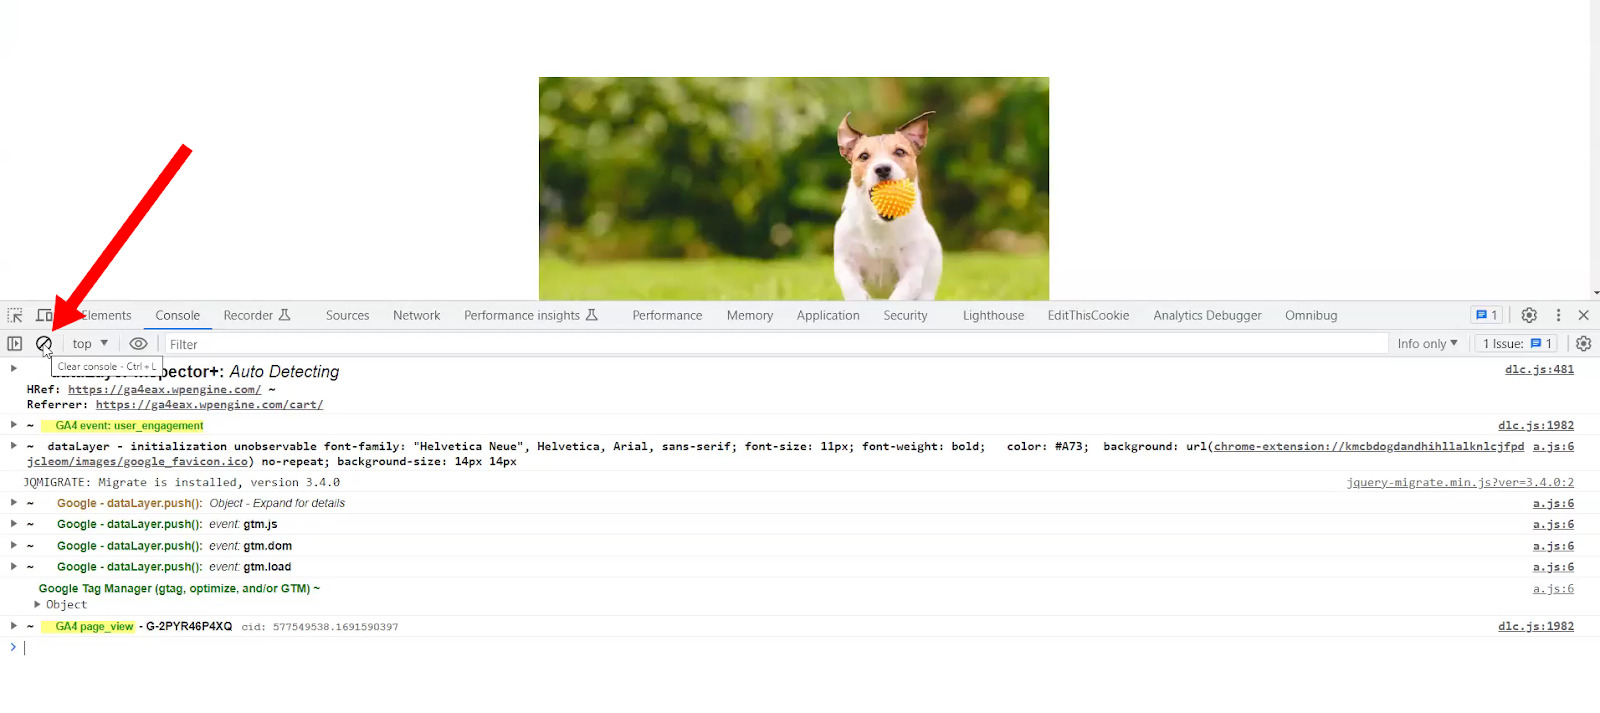
- Clear Entries: When you open the console initially, you will usually find it full of all kinds of information. Use the circle with a slash icon at the top left (or CTRL+L) to clear all data on the console and start from scratch.
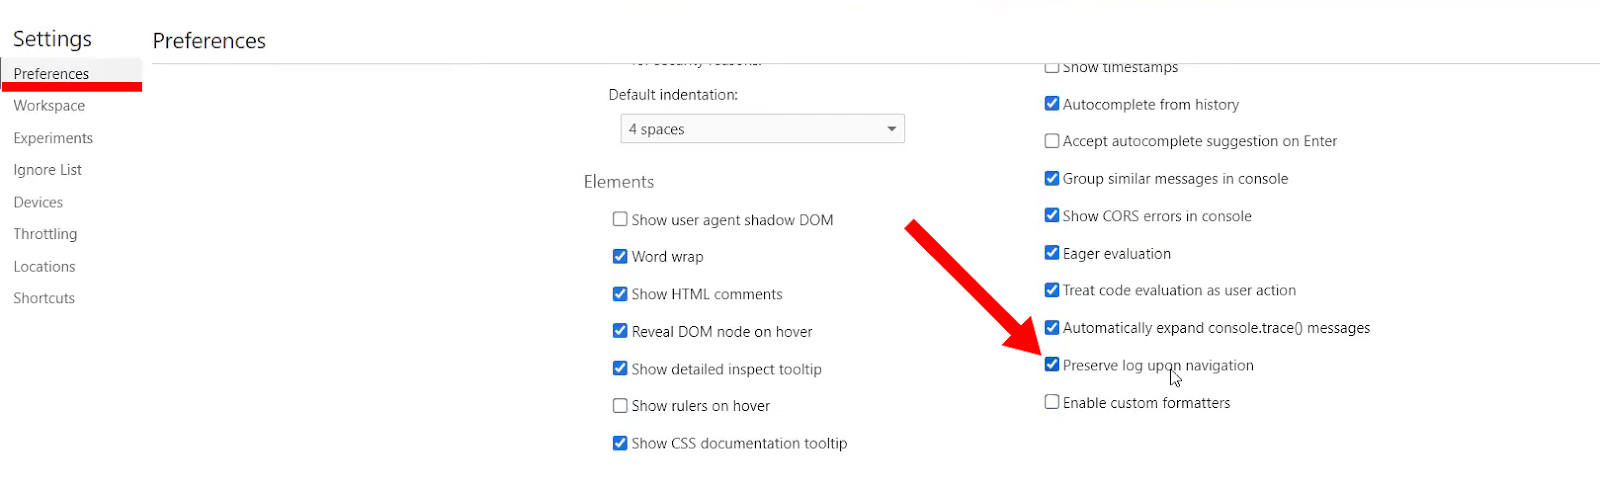
- Preserve Navigation: To preserve data as you navigate between pages, open the settings menu by clicking the cog icon at the top right of the console, then scroll down the list of preferences until you find Preserve log upon navigation. Make sure this box is checked before you start navigating.
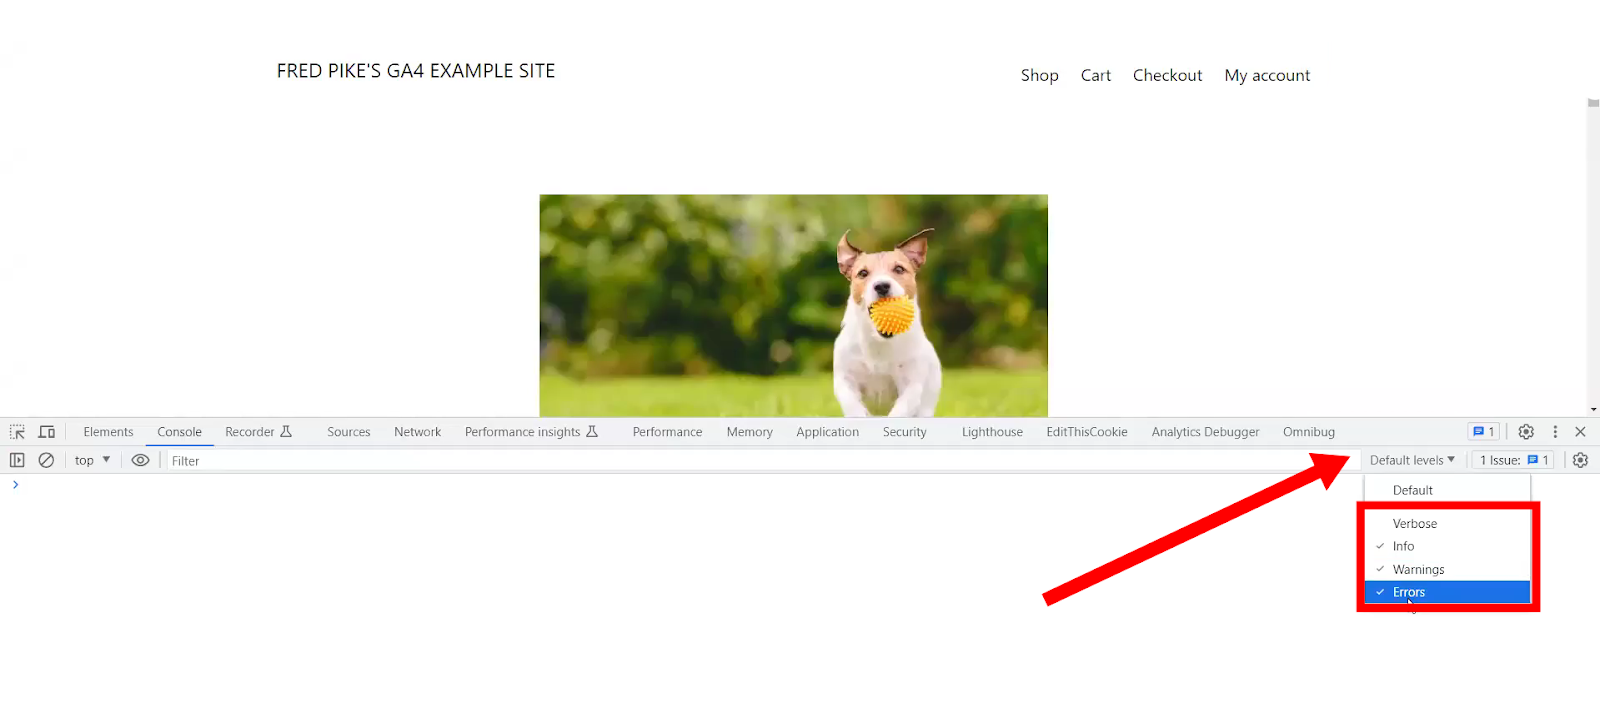
- Error Messages: From the Console tab, use the Default levels dropdown at the top right to determine how much information you want to see. You may want to hide errors and warnings and show info only when working with the console day to day, or select only errors if you want to locate them specifically.
Network Tab
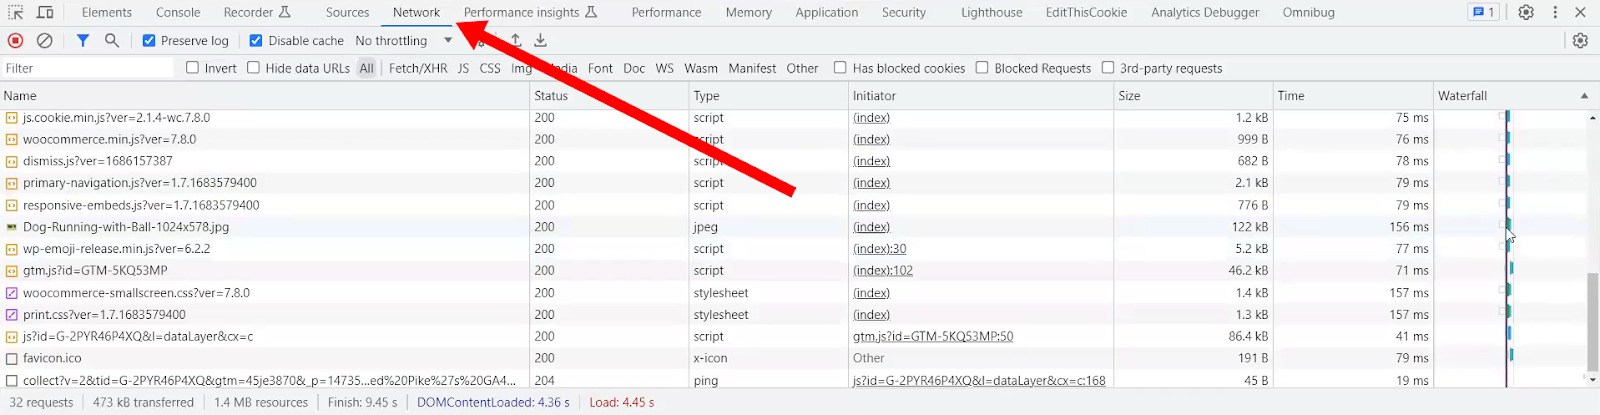
Navigate to the Network tab in the search console to see information about the page back-end e.g. Javascript, CSS, page loading time, etc. This is a single source of truth for everything happening on your site.
Finding GA4 hits
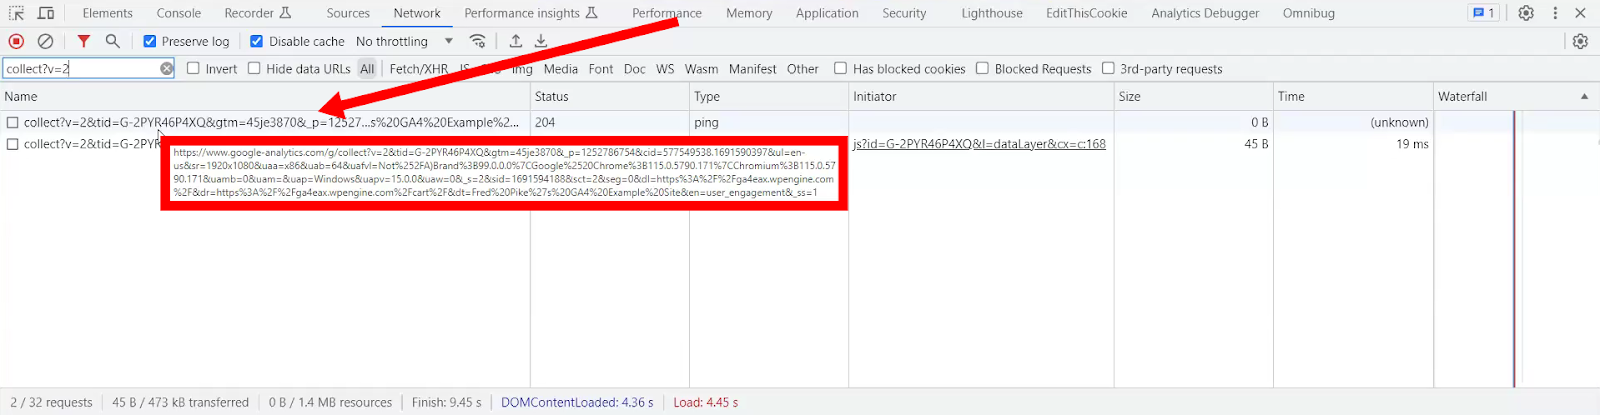
If you are not a back-end developer, a lot of this information might be irrelevant to you. However, there is also information in the Network tab about what is being sent to Google Analytics. Put “collect?v=2” in the search bar to find GA4 hits and “collect?v=1” to find UA hits. You will find the most recent hit at the bottom.
Using the Search function
You can also search for hits based on specific tracking IDs, which is the number that comes after “tid=”. This is useful if you have more than one tracking ID on your site.
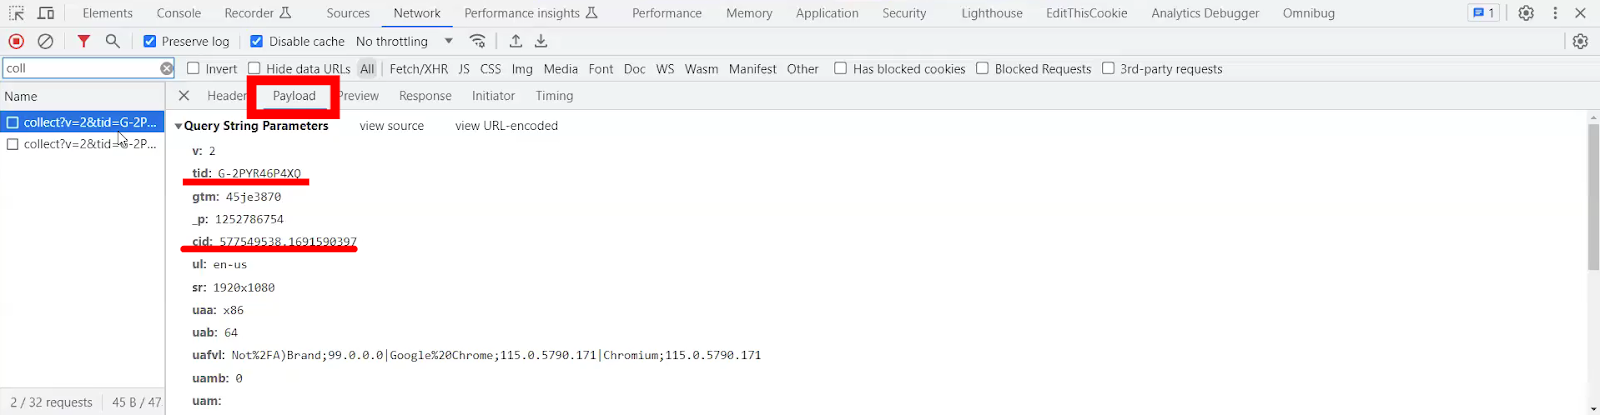
Click on the hit to see information about what gets sent to GA4. The Query String Parameters will show up in the search console window in the Payload tab. This information includes the Measurement/Tracking ID (tid), Client ID (cid), Event Name (en), etc.
If you want to search for page view events, put “en=page_view” into the search bar. Even though this exact text doesn’t show up in the list of hits on the Payload tab, you can see the full version in the Headers tab, which is where you can find the complete URL details of exactly where the information is being sent.
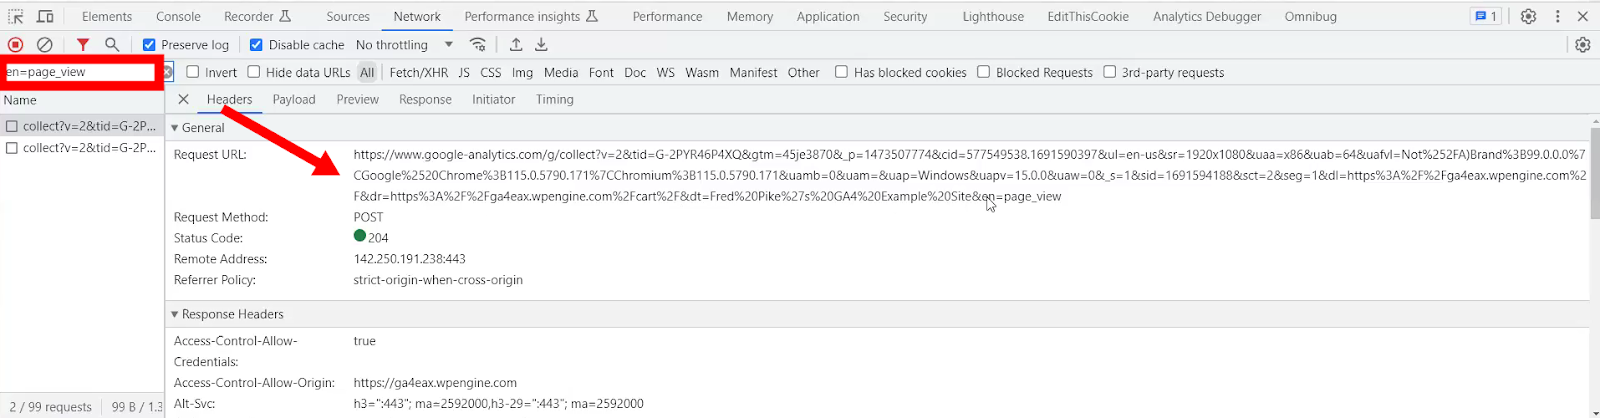
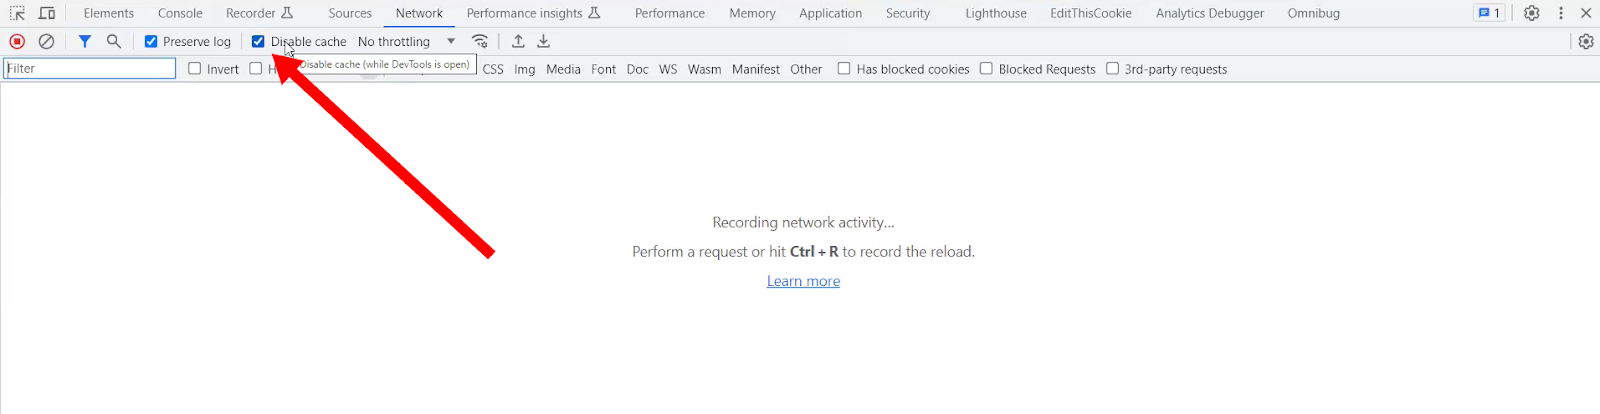
To give yourself a bit more space on the network tab, make sure Disable cache is checked.
Overall, the network tab is great for finding out all the details of what is being sent to GA4, but it is hard to work with. There are some Chrome extensions available which make using the dev console much easier.
Key Chrome Extensions
The extensions we are going to look at work with any Chromium-based navigator and add a level of abstraction to the source of truth we have in the network tab.
Adswerve dataLayer Inspector+
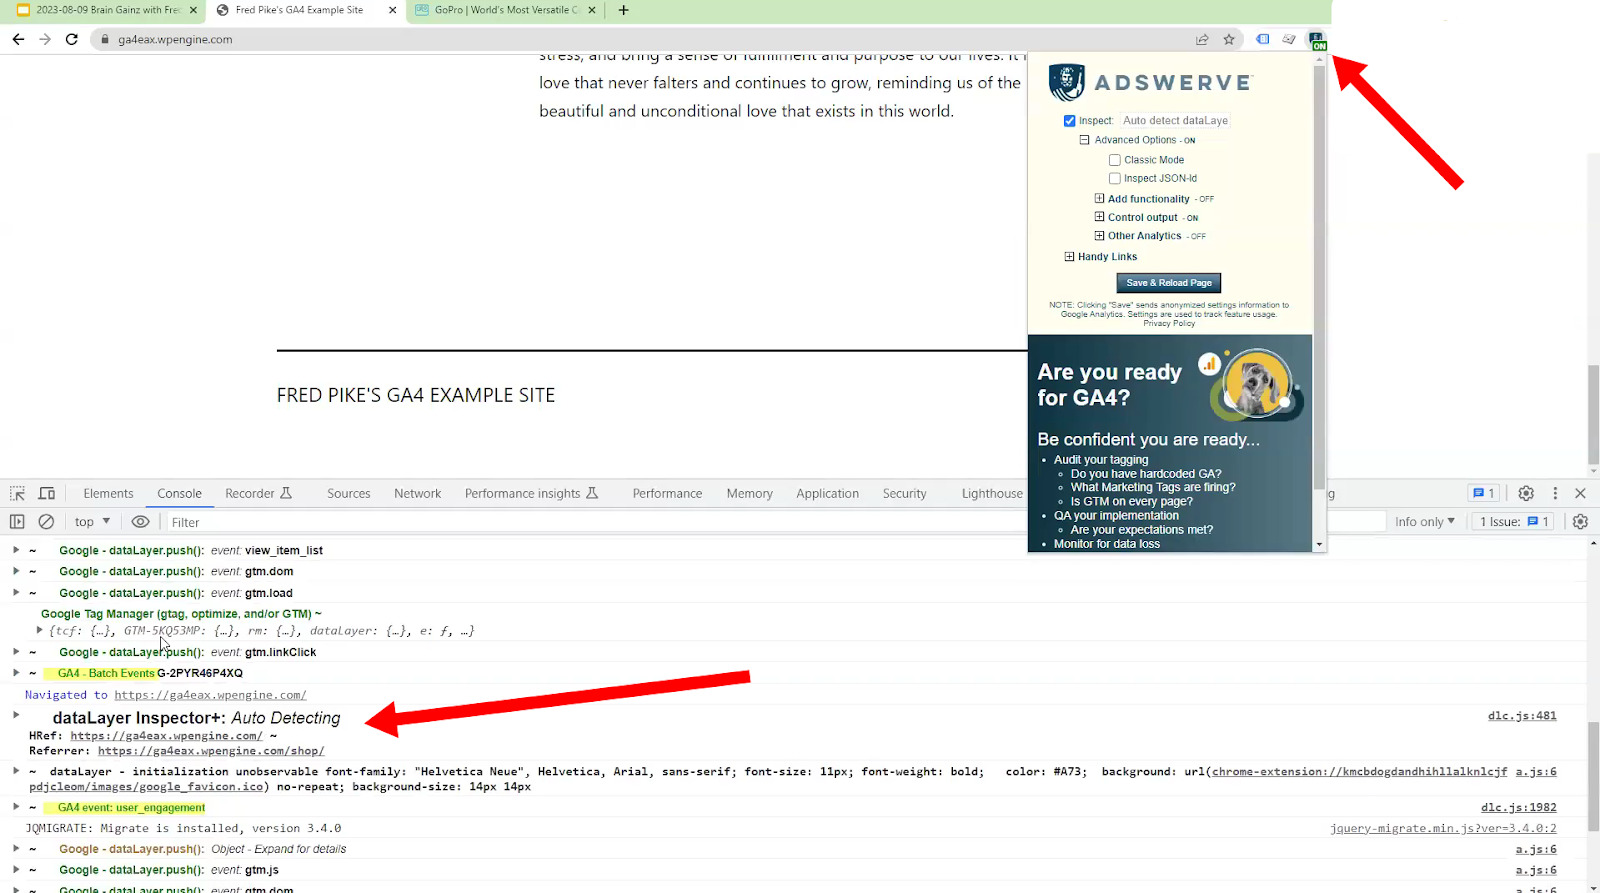
The Adswerve dataLayer Inspector+ will take the network tab information and make it easier to read, highlighting in yellow any GA4 events so that you can see at-a-glance what is going on.
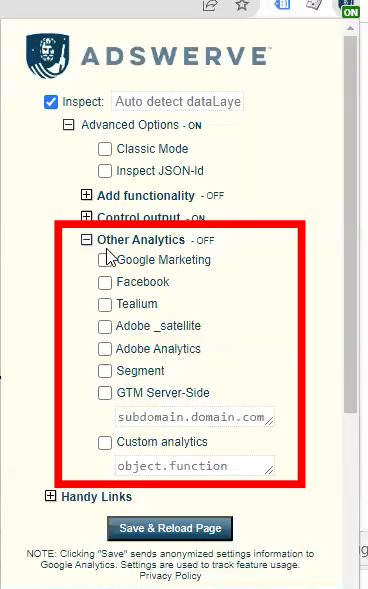
You also have the option to highlight other events besides GA4, such as Google Marketing, Facebook, etc.
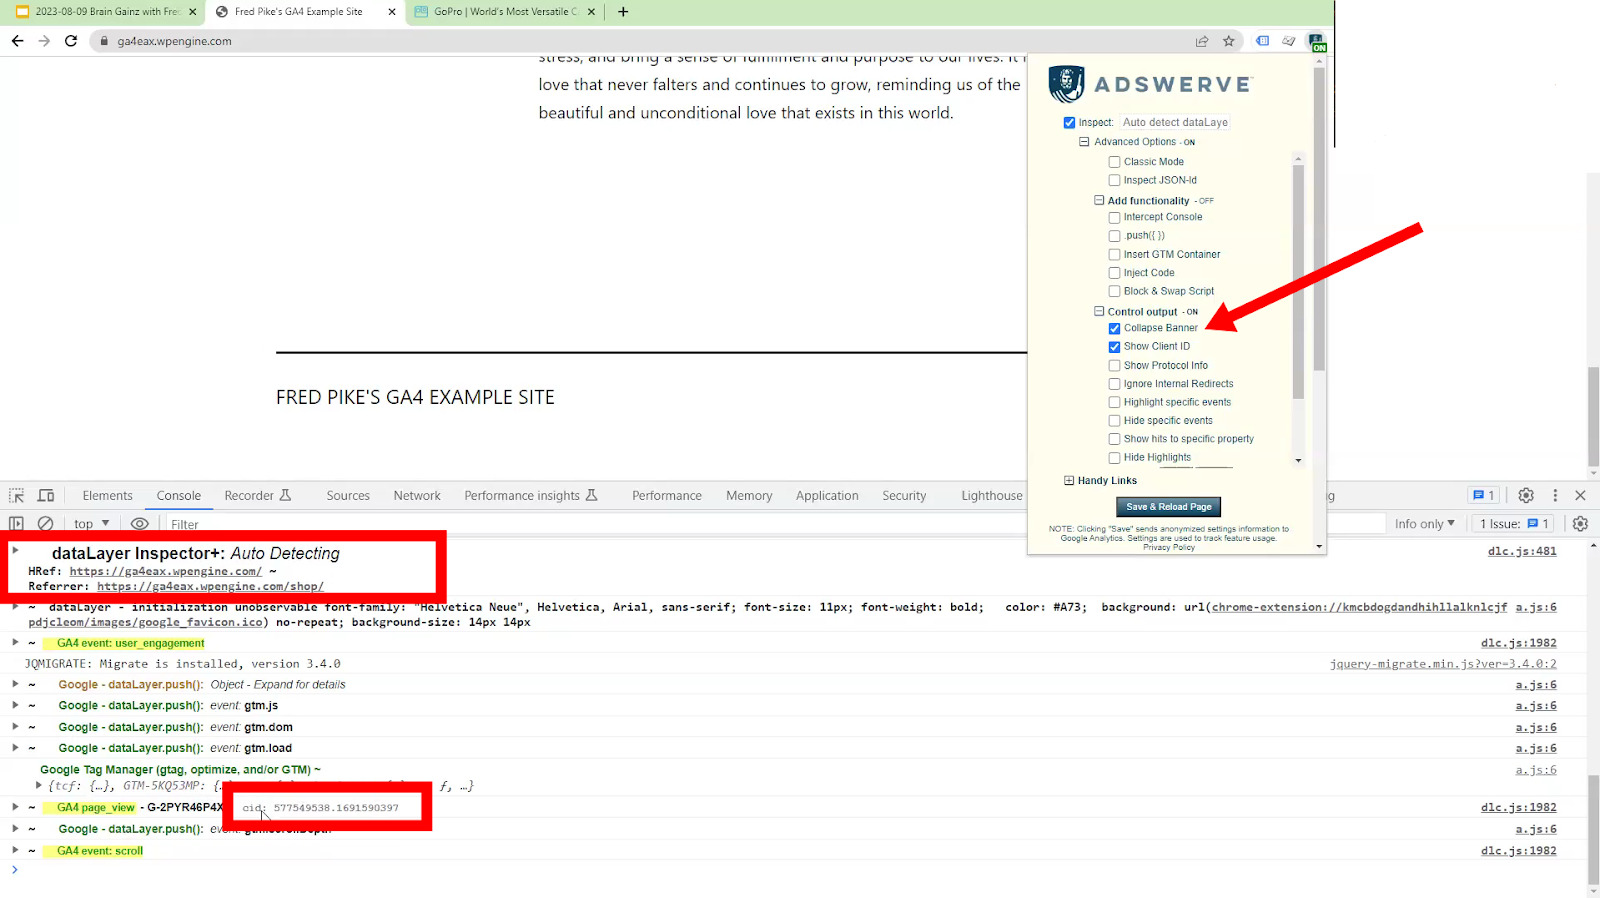
Make sure you check Show Client ID so you get the cid next to each hit. You can also check Collapse Banner to remove the dataLayer Inspector+ heading and free up space on the console.
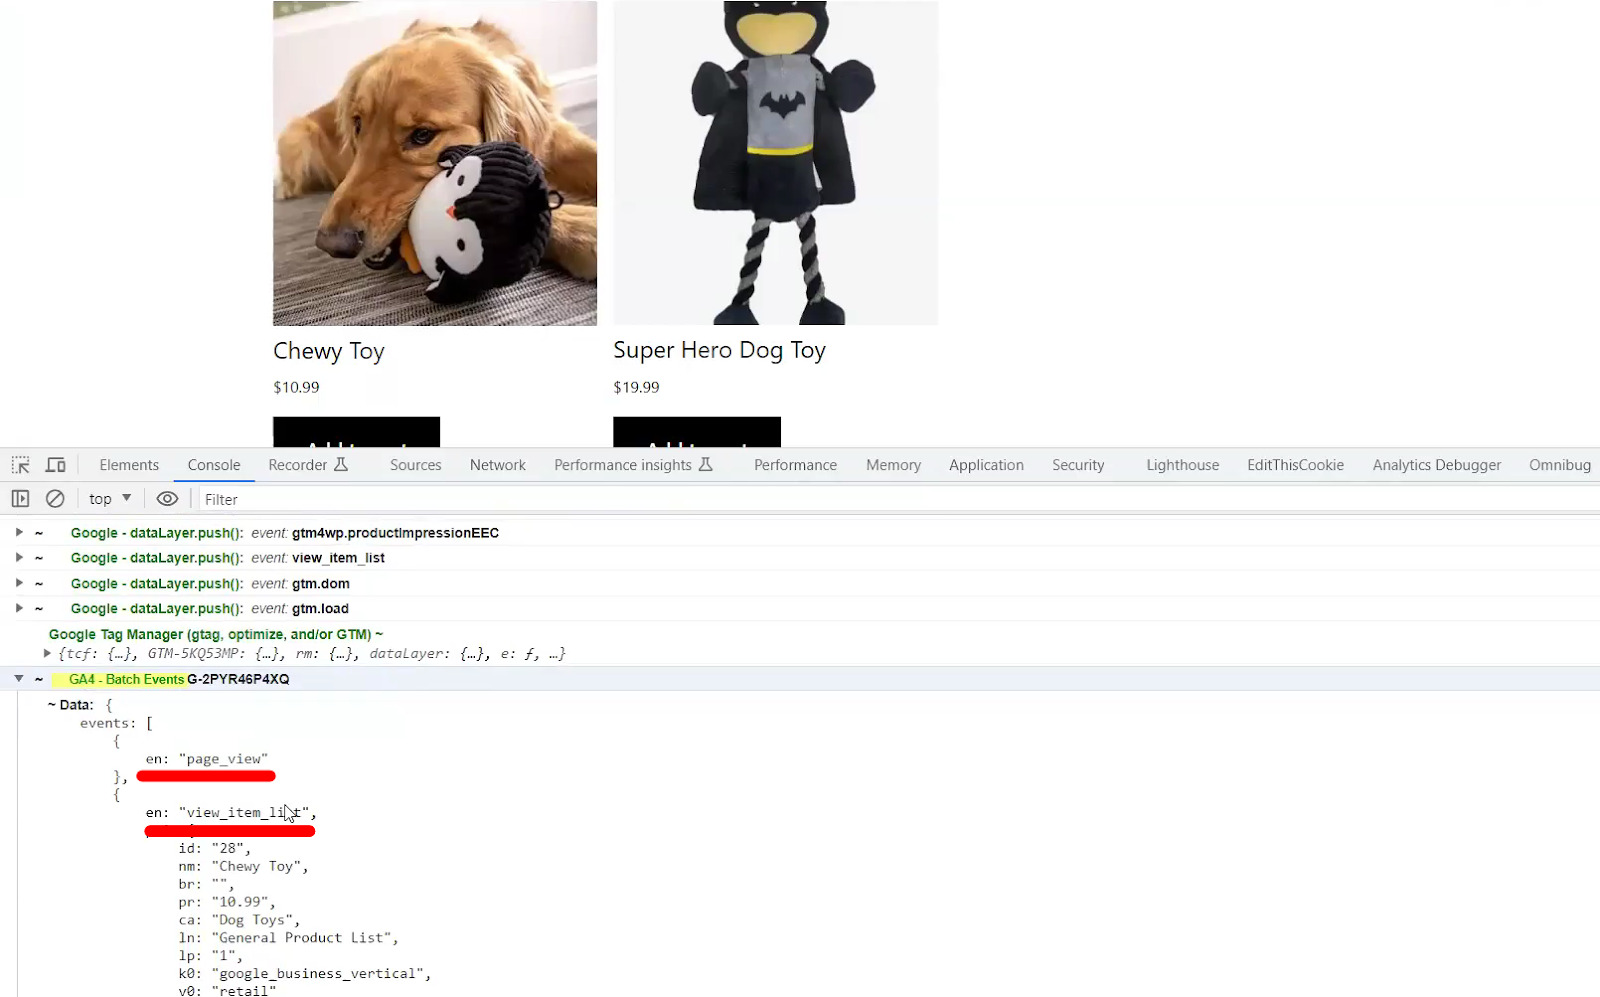
To use this extension to audit an ecommerce site, you will usually want to check the products page first. When you find a “view_item_list” event on the search console, you should find the corresponding “view_item” and “page_view” event details in the dataLayer Inspector, which lets you review all of the information being sent about each of the products.
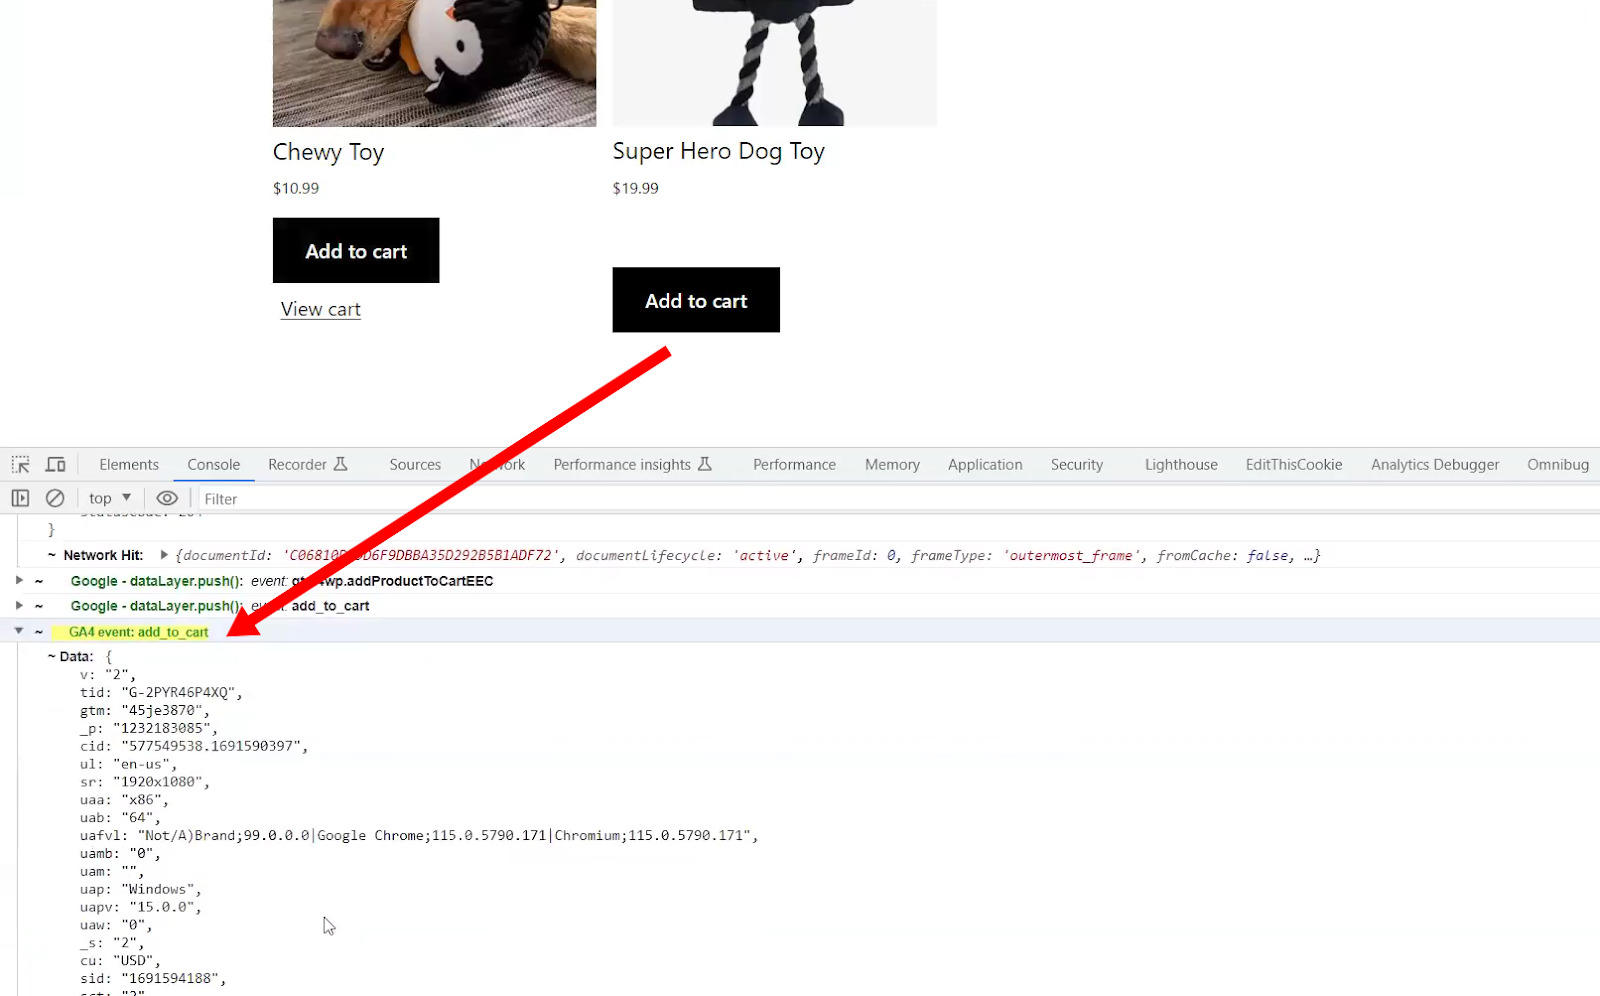
When auditing an ecommerce site, you would also want to check all of the “Add to cart” transactions as this is an area where many websites fall apart. There are usually three different places where you can do this.
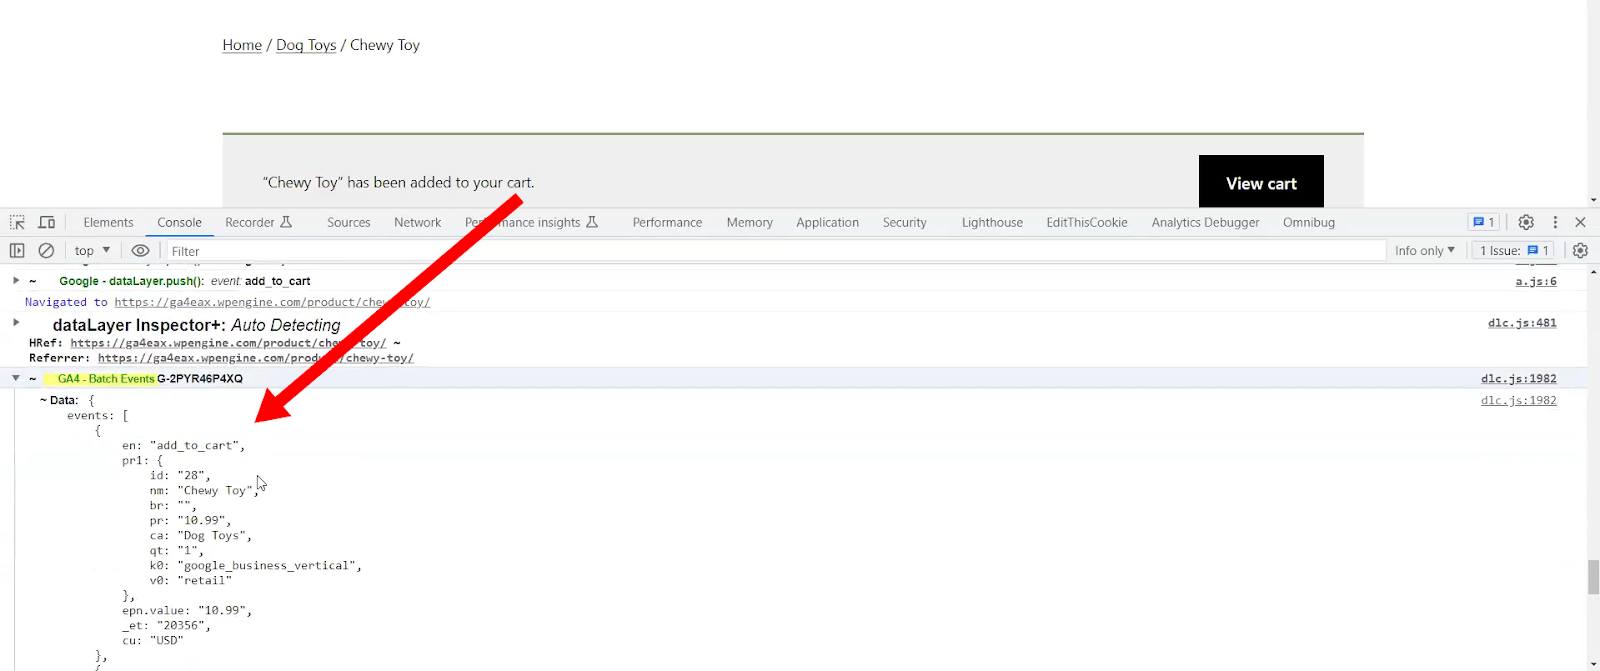
The first one is by clicking the “Add to cart” button on the shop page. This should bring up the “add_to_cart” event in the dataLayer and also in the GA4 events. You should see a list of all the information being sent in the items array. Check the array to make sure everything you need is being included.
The next location for adding the item to cart is on the individual product page.
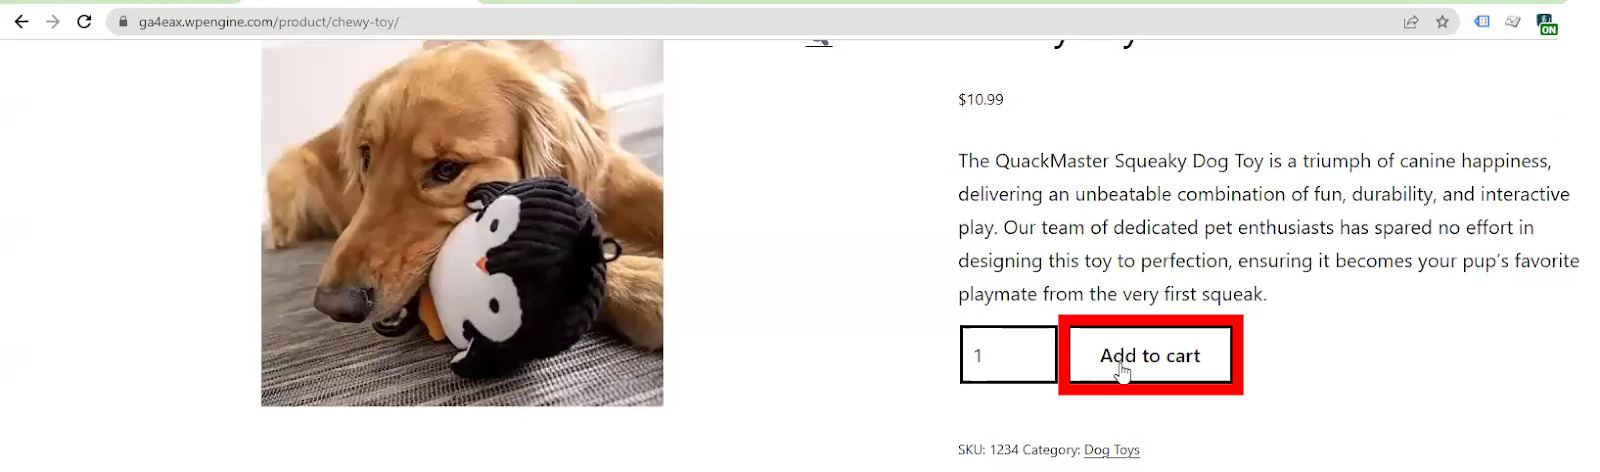
Again, check for the “add_to_cart” event in the dataLayer and the GA4 events and review the data being sent to ensure everything you need is included.
The third “Add to cart” location is on the actual checkout step, where you can increase the number of items.
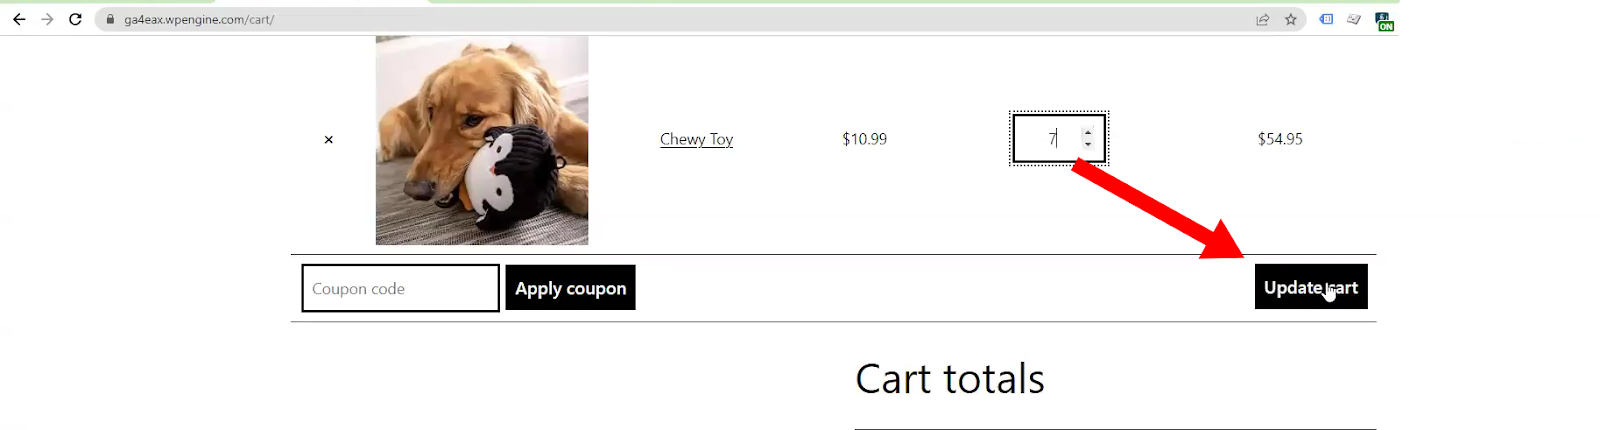
After updating the cart, you should find a new “add_to_cart” event with only the additional items.
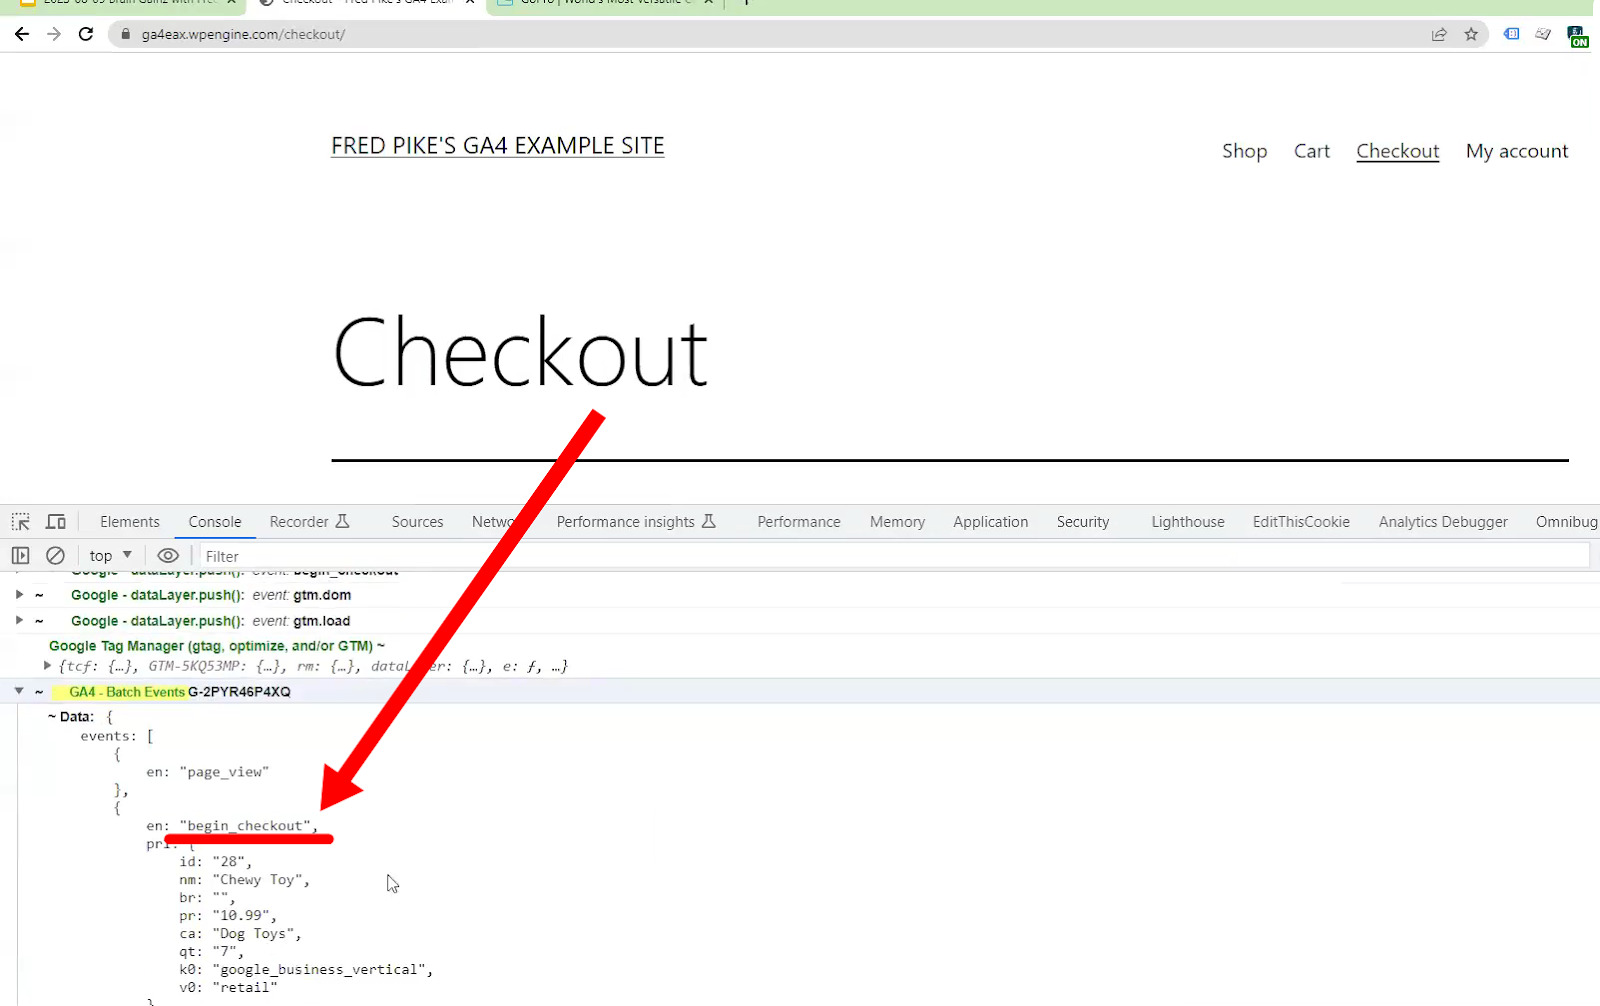
Finally, on the Checkout page, ensure you have the “begin_checkout” event in the dataLayer and being sent to GA4.
Analytics Debugger
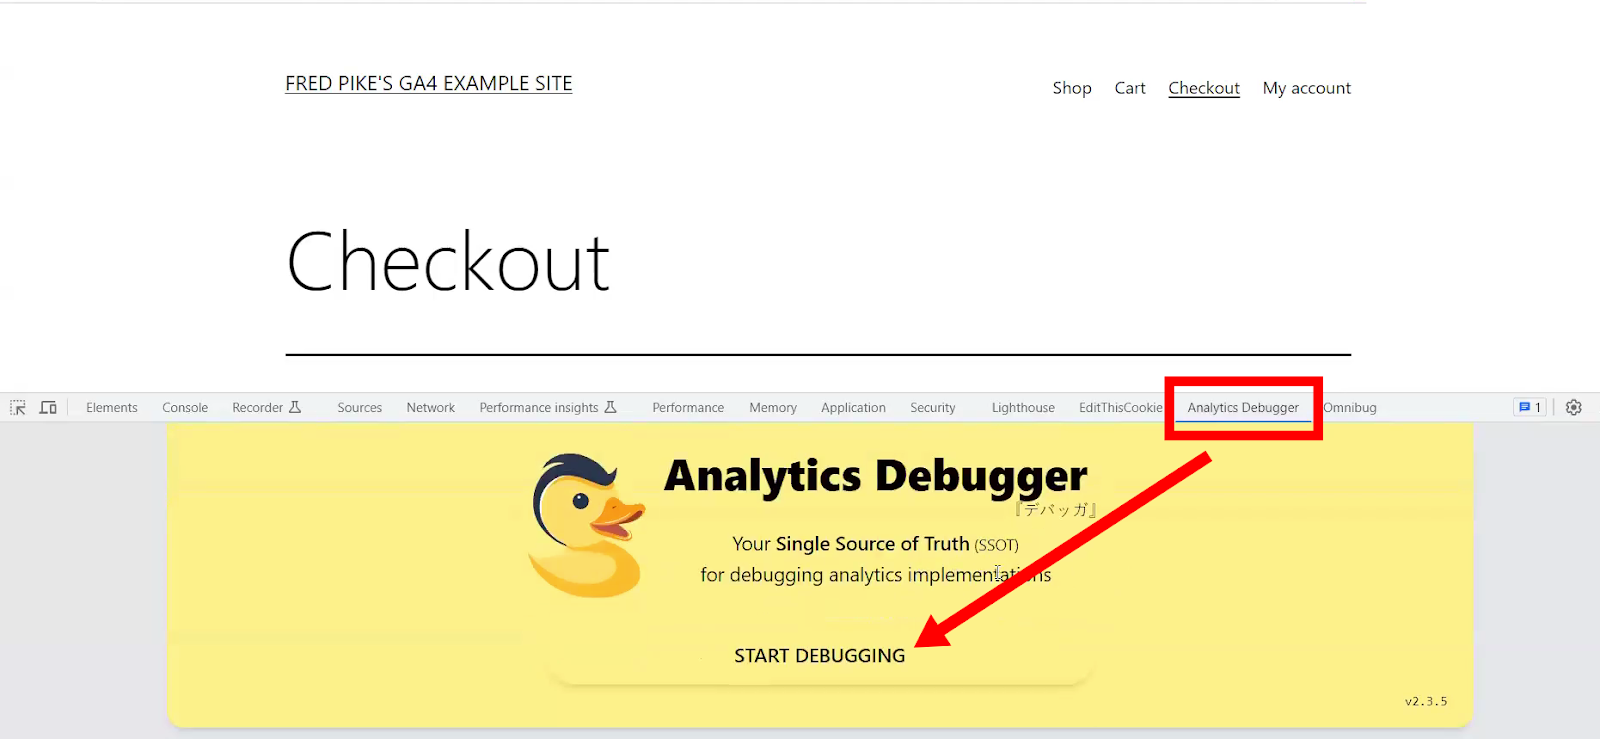
The second browser extension that can give you an even cleaner view of the same information is the Analytics Debugger, developed by David Vallejo.
Navigate to the Analytics Debugger tab in the console and click Start Debugging to activate it.
You will find the information presented in a very digestible format, with GTAG, GA3, and GA4 data separated into different tabs.
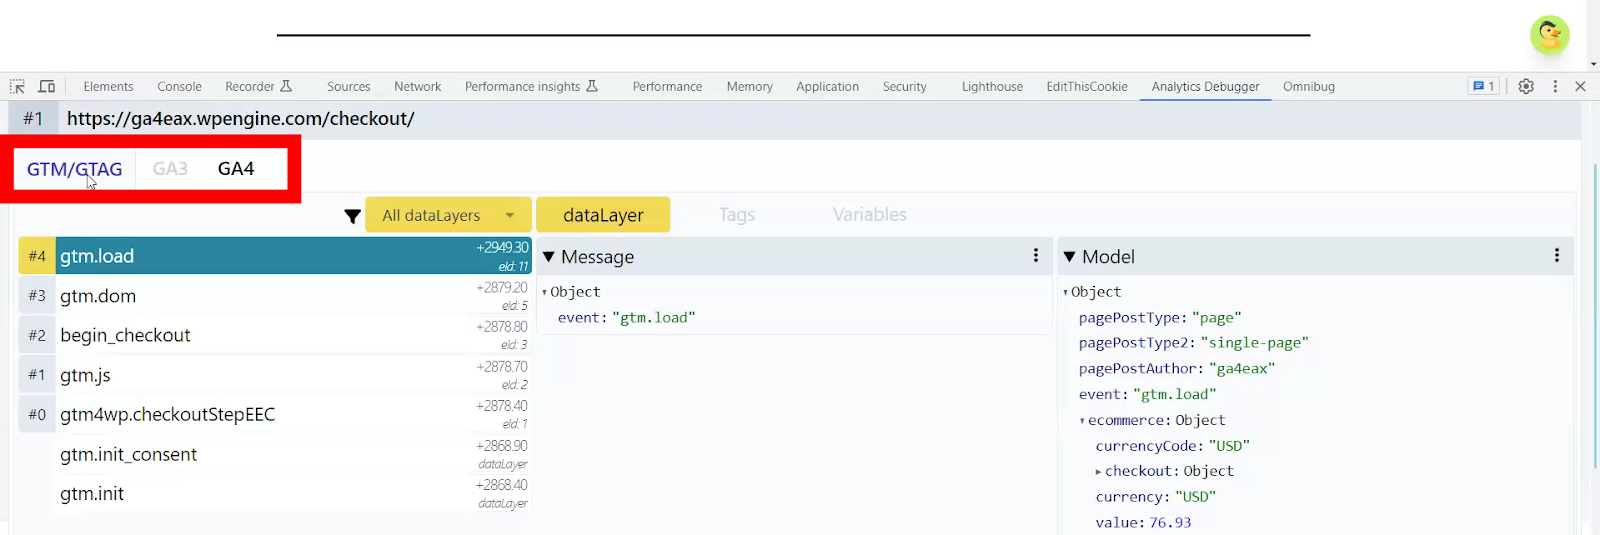
If you complete the same “Add to cart” transaction now, you’ll see the event highlighted in the events list, with all the data being sent in the Overview section.
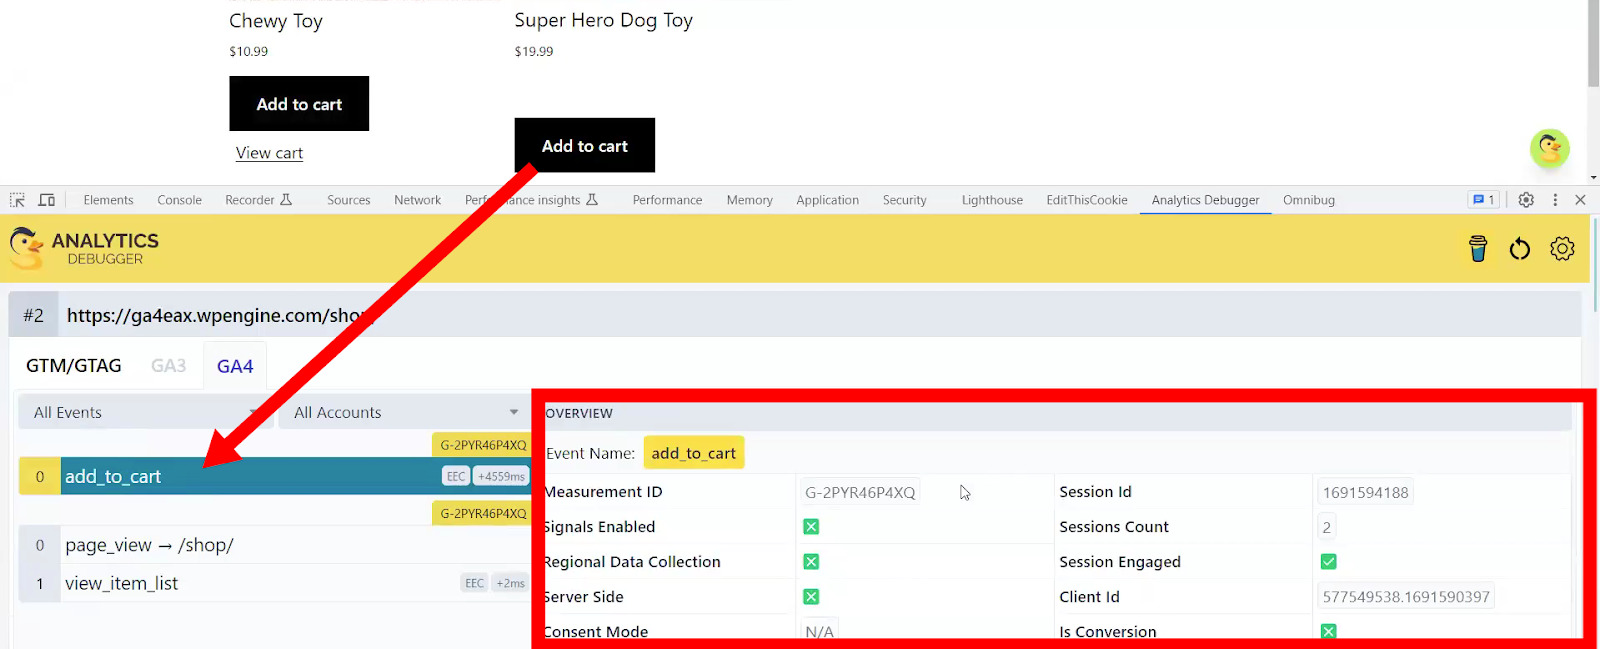
Another thing that the Analytics Debugger does is to list all the parameters in their full form, rather than just the abbreviation i.e. “Tracking ID” not “tid”. This is very useful if you find it difficult to remember all the abbreviations.
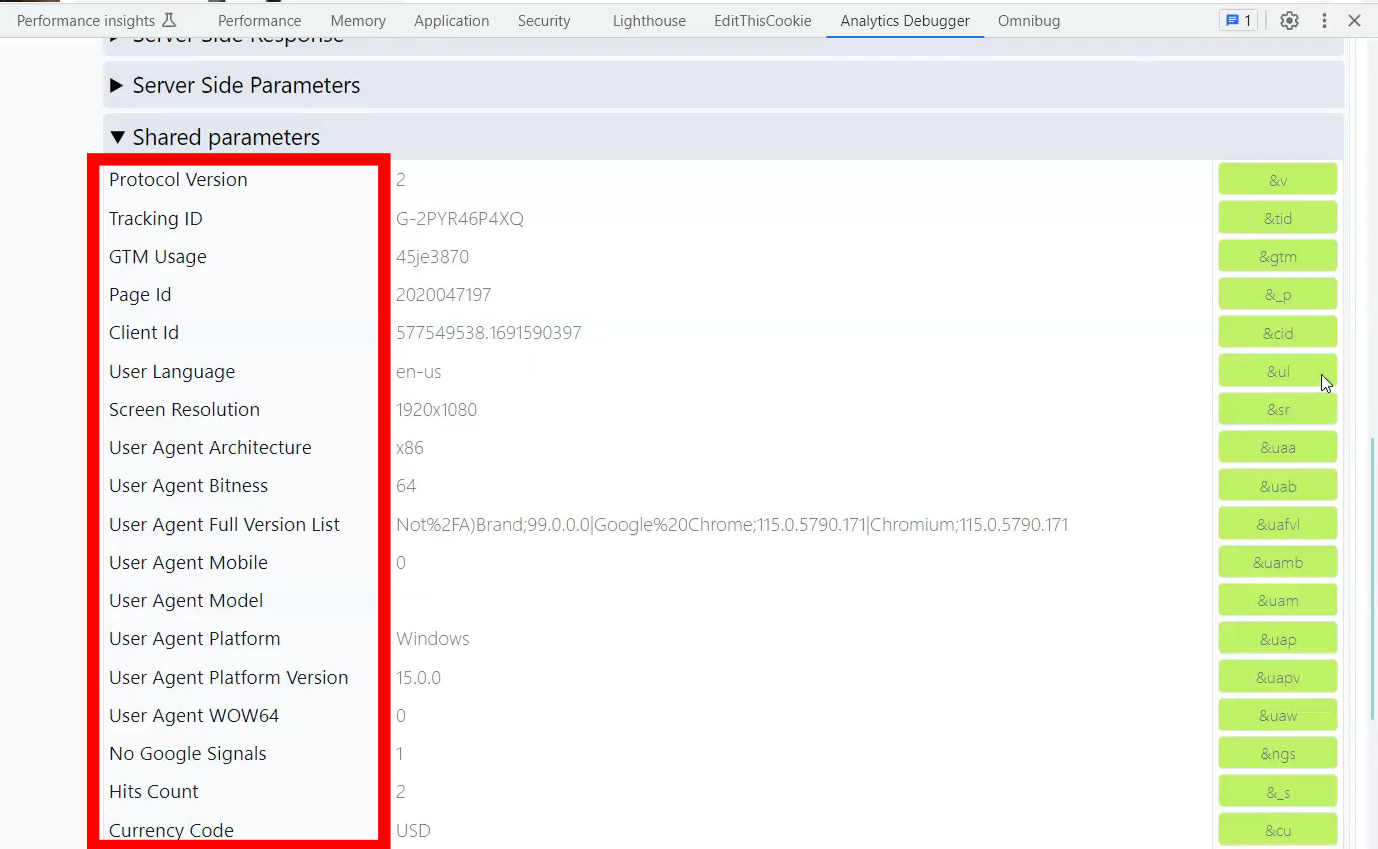
Additionally, the payload details will still appear in their raw format in case you want to review them.
Other Chrome Extensions
Here are a few other Chrome extensions that you might want to try.
Omnibug
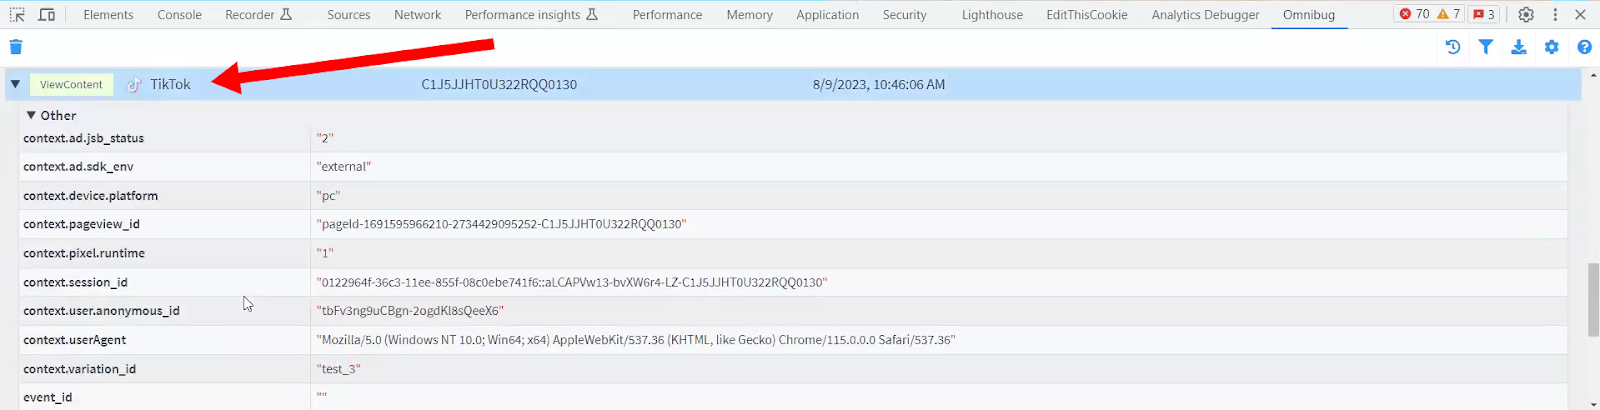
The Omnibug extension reports on every marketing tag you have on your site, not only with GA4. For example, you’ll also see UA hits, Bing Ads, Facebook, TikTik, etc.
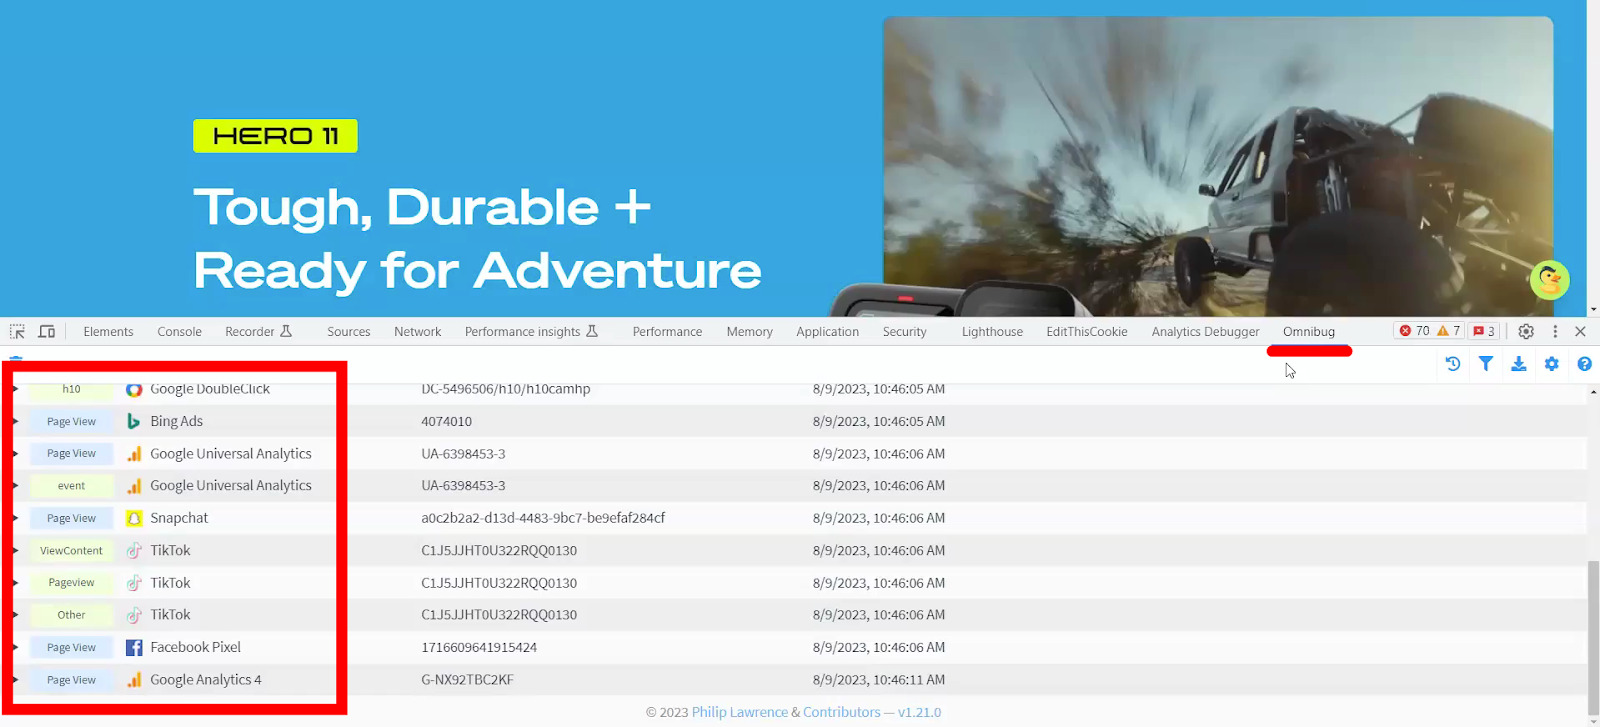
Click on any of them to see more details.
EditThisCookie
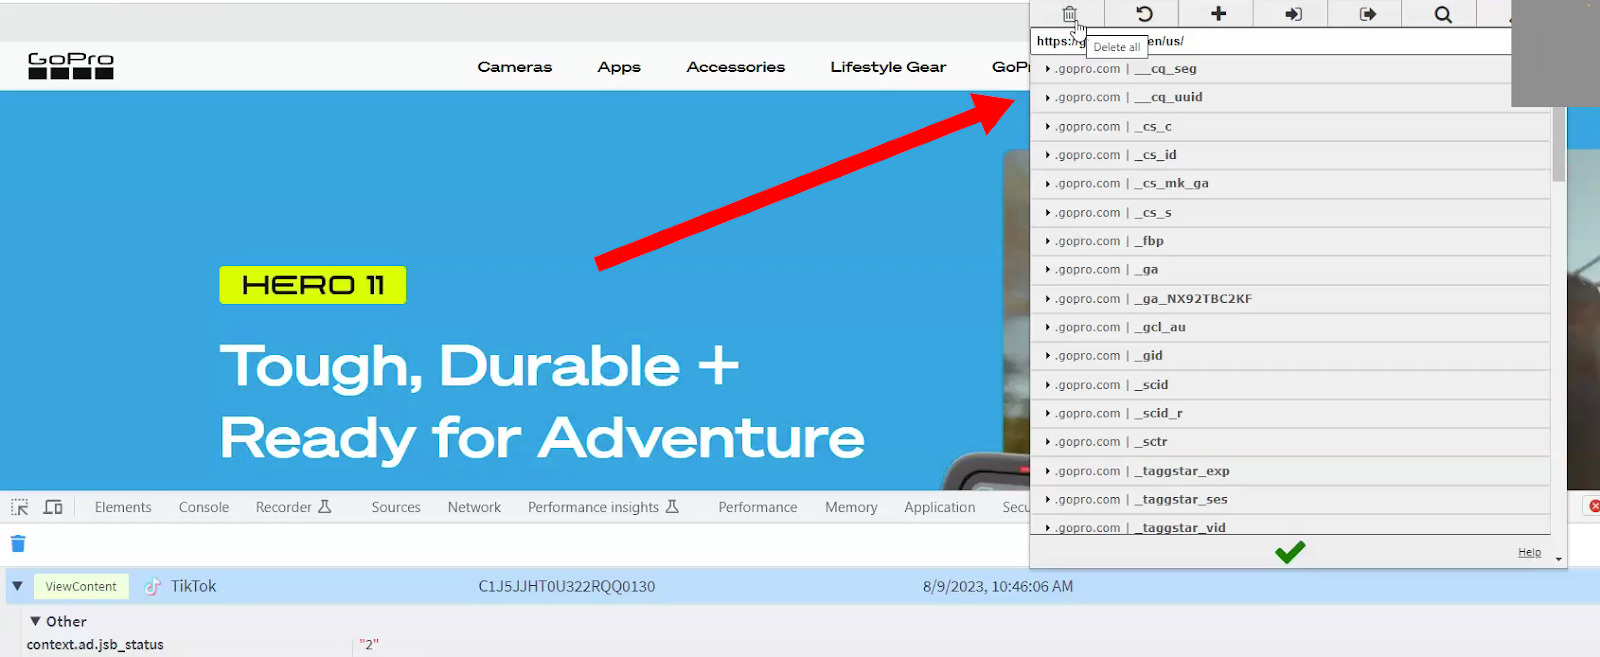
The EditThisCookie extension shows you a list of all the first party cookies on your site and what they are for. It is also a good way to clear cookies easily for testing purposes. Use the delete icon to clear them all.
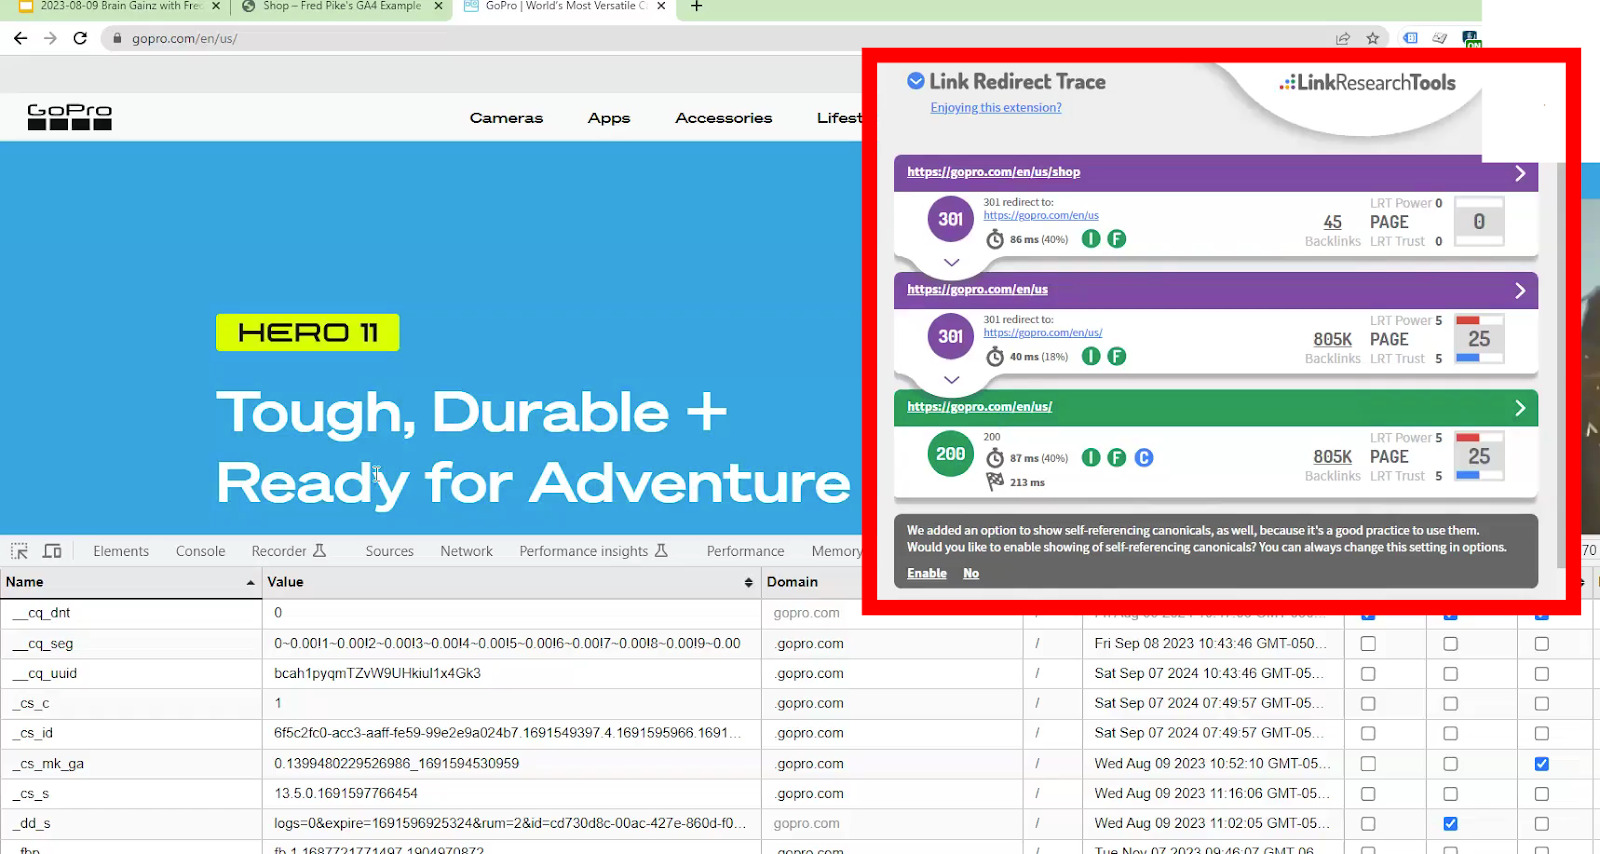
Link Redirect Trace
Link Redirect Trace helps trace your link redirects when you are having issues. This tool clearly shows where redirects are happening on your site.
Case Studies
There was an issue recently with the Debug View for GA4 where every event was showing up twice. But how would you know if there was an issue with the debug view? We are going to look at three different case studies with different approaches to troubleshooting.
GA4 DebugView
If things don’t look right, it’s useful to compare information in your different information sources. For example, if you find a page view showing up on the console, you’d want to cross-check that with Google Tag Assistant and the Analytics Debug View.
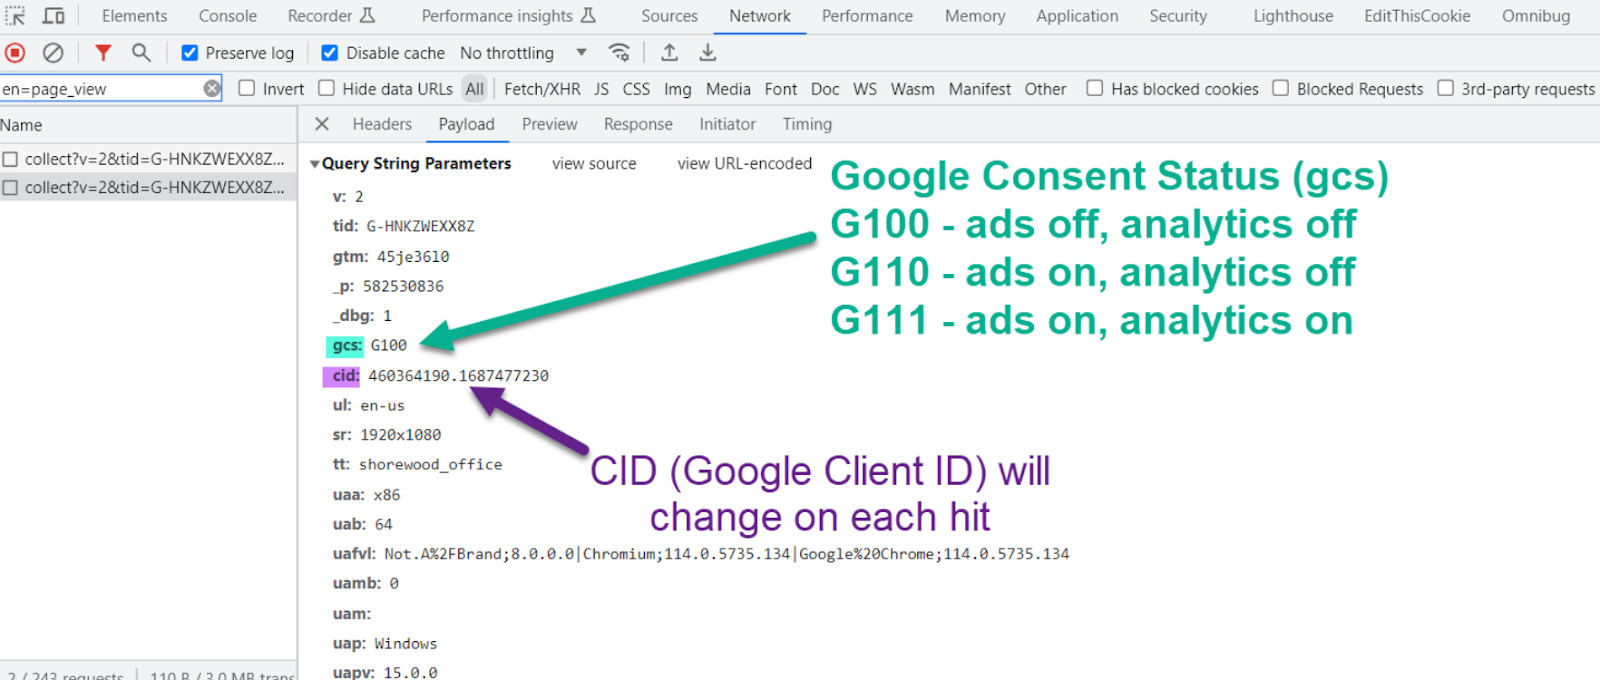
If the page view is missing from Analytics, this may be down to the Google Consent Status (gcs).
There are three different possible Google Consent Statuses: G100 means ads off and analytics off; G110 means ads on but analytics off; G111 means ads on and analytics on. With the G110 status (where analytics is turned off), you will see the event in GTM and the search console but not in Analytics. You will also notice that the client ID will change for each hit when Google Consent Mode is turned on.
Just change your consent status to turn it back on.
Server Side GTM Hit
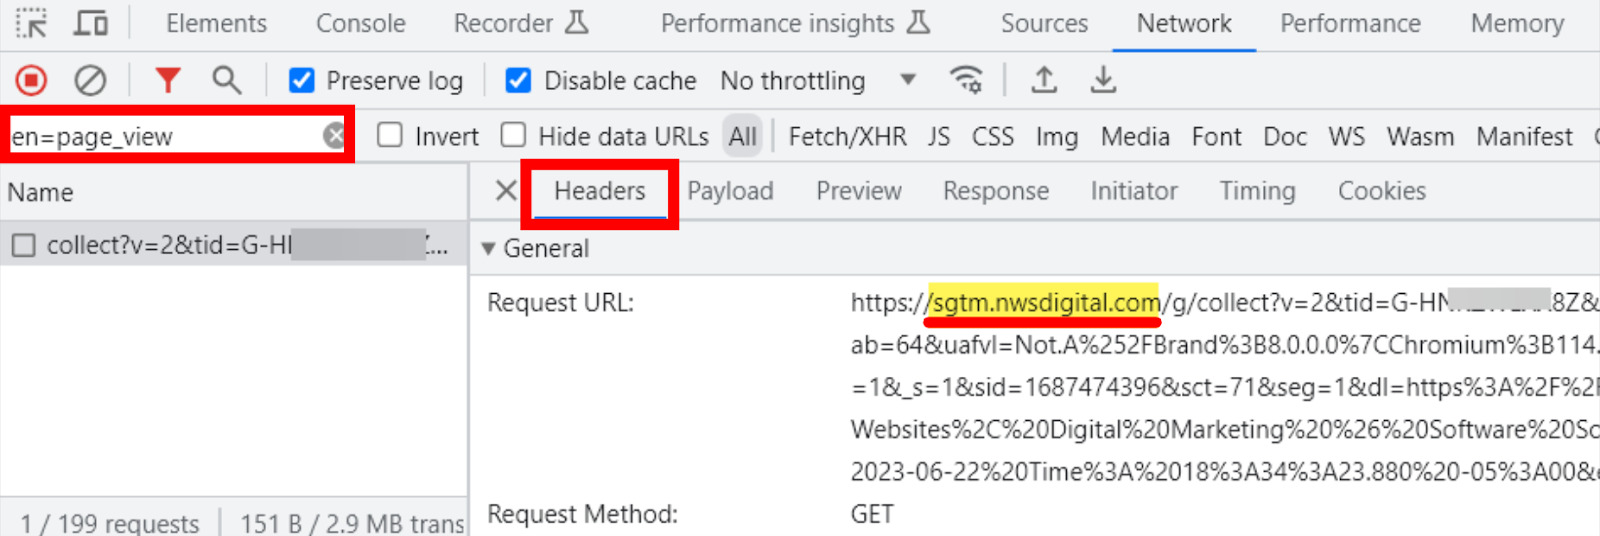
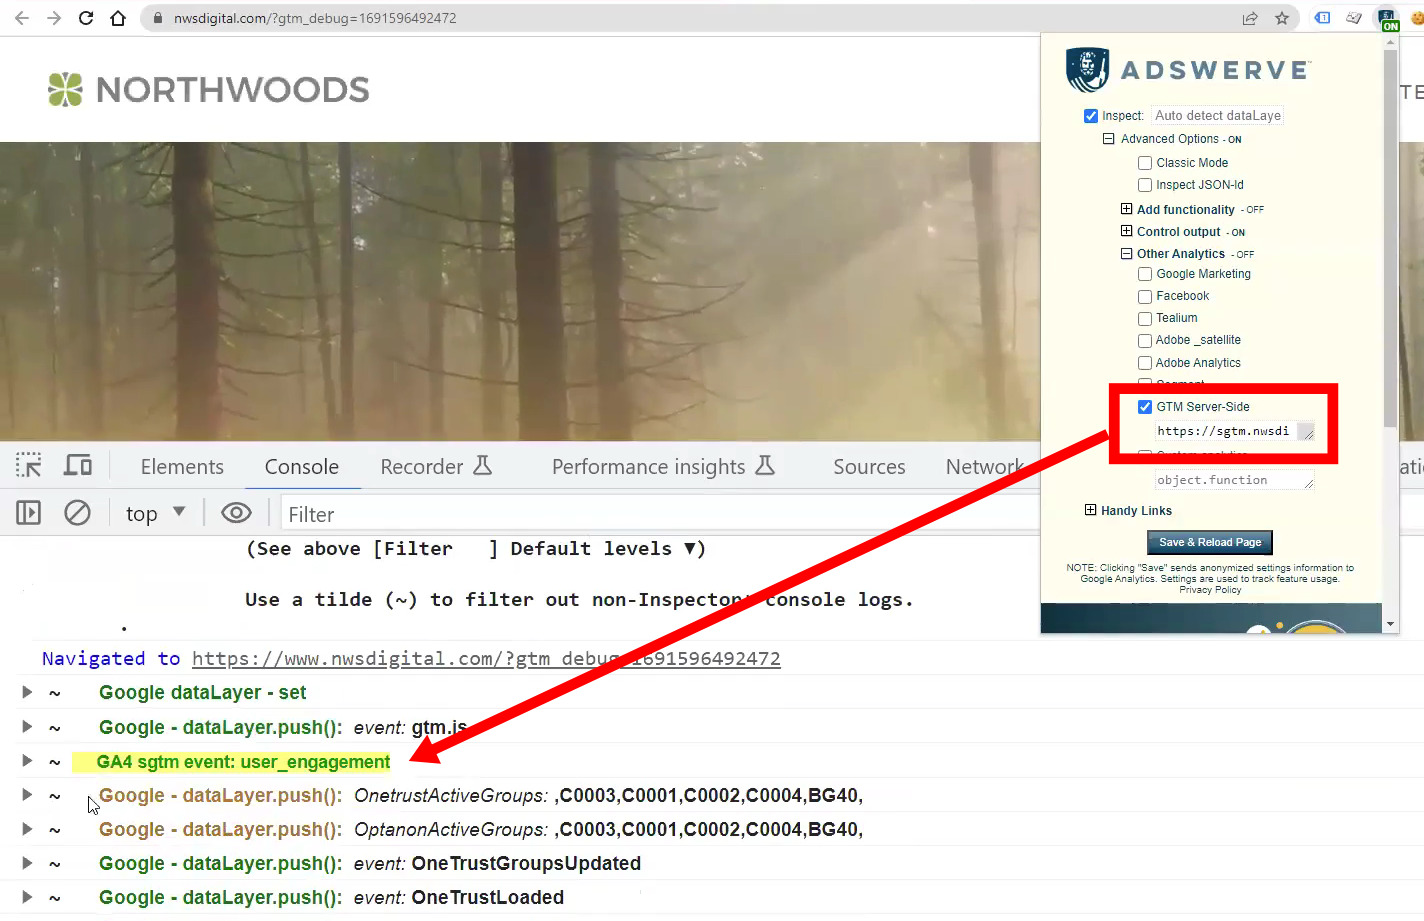
Conversely, you may find the page view showing up in the Analytics Debug View and GTM but not in the search console. This happens when the hit is a server side GTM hit.
You can confirm this by checking the full url in the Headers tab and looking for “sgtm”.
To ensure server side hits are showing up on the console, make sure GTM Server-Side is checked in the dataLayer Inspector+ extension.
Debug Tools (and links)
- dataLayer Inspector +
- Analytics Debugger (David Vallejo / Thyngster)
- Google Analytics Debugger
- Tag Assistant Legacy (by Google)
- Omnibug
- EditThisCookie
- Link Redirect Trace
- Website Auditor (PowerSEO – desktop tool; not chrome extension)

