The Google Ads Calculator is a tool developed in-house at Data Driven and has proved to be one of our most downloaded resources and biggest lead generators since we published it in 2015. Since then, it has been through some iterations and today we are going to look at the latest version we created for ecommerce.

The million dollar sales tool
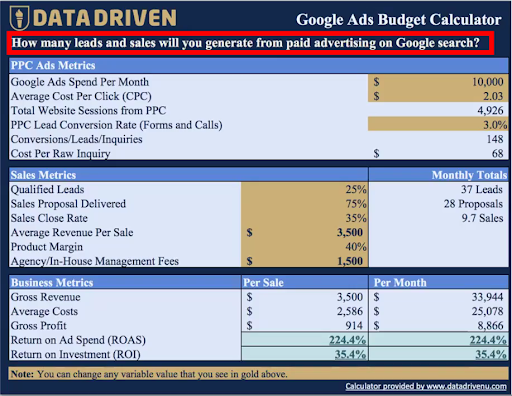
So why is the calculator such a priceless sales tool? It’s because it helps you understand the whole picture that conversion tracking data doesn’t always tell you, incorporating data such as customer lifetime value, offline sales tracking, agency fees, product margins, etc. The version that has proved the most popular, with over 100,000 downloads, is the Google Ads budget calculator for lead generation campaigns.
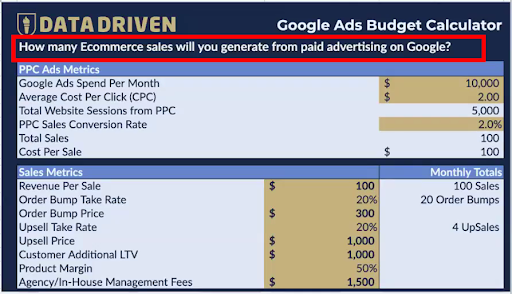
The newest version that we have created is for ecommerce and funnels.
How it works
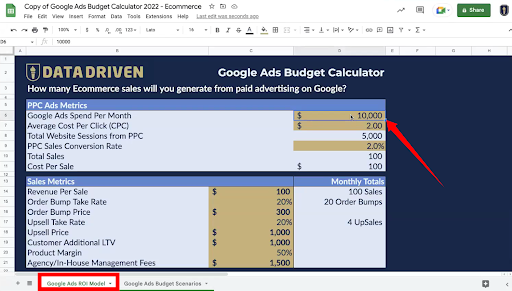
Download the template, then make a copy so that you can edit it.
On the Google Ads ROI Model tab, you can find the ecommerce calculator that will help you calculate ROI based on pay-per-click ads and is focused on data and conversions. The calculator takes into account each step of the funnel to see where there might be scope for improvement.
If you have a specific goal, for example, you want to expand your reach over the next 12 months, you can use this calculator to run different scenarios. You can see what happens if you invest $5,000 a month in Google Ads; how does this impact on your sales and business metrics? Tweak the values to see how that impacts your numbers.
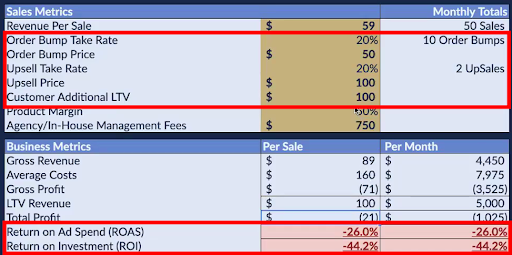
Customer Lifetime Value is an important metric to take into account, as this has a big impact on your ROI. When you incorporate the upsell and order bumps rates and values, you get a more realistic picture of customer LTV.
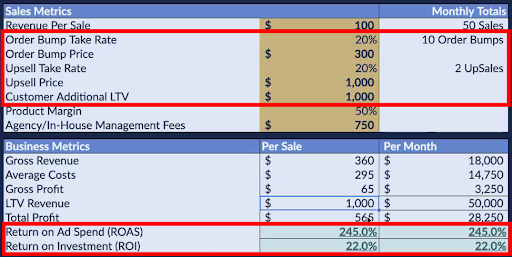
We can see how the ROAS and ROI quickly deteriorate if these values go down. This lets you know what your target LTV should be in order to stay profitable.
The second tab lets you run different scenarios so you can see how much you need to spend in order to reach your goal.
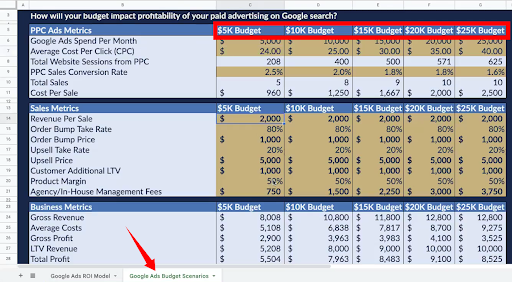
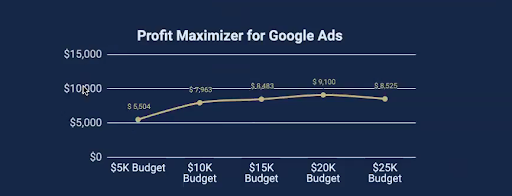
As your budget increases, the CPC may go up and the conversion rate might go down to reflect the fact that you are getting in front of a wider and less targeted customer base. In addition, agency fees might be cheaper the more you spend. All of this data is factored in on the calculator to help you see where the sweet spot is for your investment.
On the scenarios tab, to the right, you can see this data mapped onto a graph. The Profit Maximizer graph is a very persuasive tool to show clients exactly how much they should be investing either on new or existing campaigns.