In March 2024, Google Analytics 4 abruptly introduced key event rate as a new website metric. The new definition of one of the most popular marketing metrics of all times, conversion rate shocked and confused marketers, analysts and business owners. If you are one of them, read on and learn how you can use GA4 key event rates to your advantage…
Before reading on, make sure you understand the difference between conversions and key events in GA4.
GA4 key event rate in a nutshell
- Key event rate metrics in Google Analytics 4 are in fact conversion rates but only for traffic that is not generated by Google Ads.
- GA4 distinguishes two types: the user key event rate and session key event rate.
- Key event rates are calculated automatically, provided you have set up key event tracking.
- You can use key event rates in reports and explorations to do a high-level or detailed analysis of your site and campaigns outside Google Ads.
What is the difference between key event rate and conversion rate in Google Analytics 4?
Key event rate and conversion rate in Google Analytics 4 are basically the same, but the term conversion rate is exclusively used for users and sessions that come from clicks on Google Ads.
The schedule below sums it up.

Note that you won’t see conversion rates in GA4 if
- you are not running paid Google ads
- you haven’t linked your Google Ads account to Google Analytics 4
Now, let’s take a step back to make sure we are on the same page.
What is a key event rate in Google Analytics, anyway?
The key event rate in Google Analytics 4 is a metric that tells you the percentage of
- users that did not arrive on your site after clicking a Google ad and triggering a key event on your site
- sessions that weren’t driven by Google ads and during which a key event took place.
To illustrate this, let’s assume you marked the Google Analytics scroll event as a key event in your GA4 property.
- A 1% user key event rate for this particular event would mean that 1 out of 100 users (aka visitors) scroll down 90% of your website pages.
- A 1% session key event rate would mean that during 1 out of 100 sessions (aka visits), the bottom of your webpages were seen.
How is the key event rate calculated in GA4?
Google Analytics 4 calculates the key event rate automatically with a simple formula that looks like this:
key event rate = (X with key events / total X) * 100%The X in the key event rate formula can be two things:
- Users, aka visitors of your site
- Sessions, aka visits to your site
Before I get to the difference between user and session key event rates, let me explain where you can find the key event rates for your complete site or web shop.
How can I find key event rates in Google Analytics 4 for my complete site?
To do a quick high-level analysis of the key even rates of your site, follow these steps.
Step 1: Change the metrics of your GA4 home report
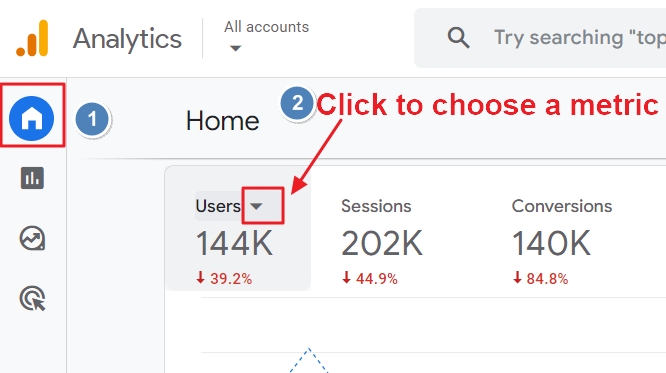
Go to the homepage of your GA4 property and click on an arrow next to the metrics of the first graph.
Step 2: Search for key event rate
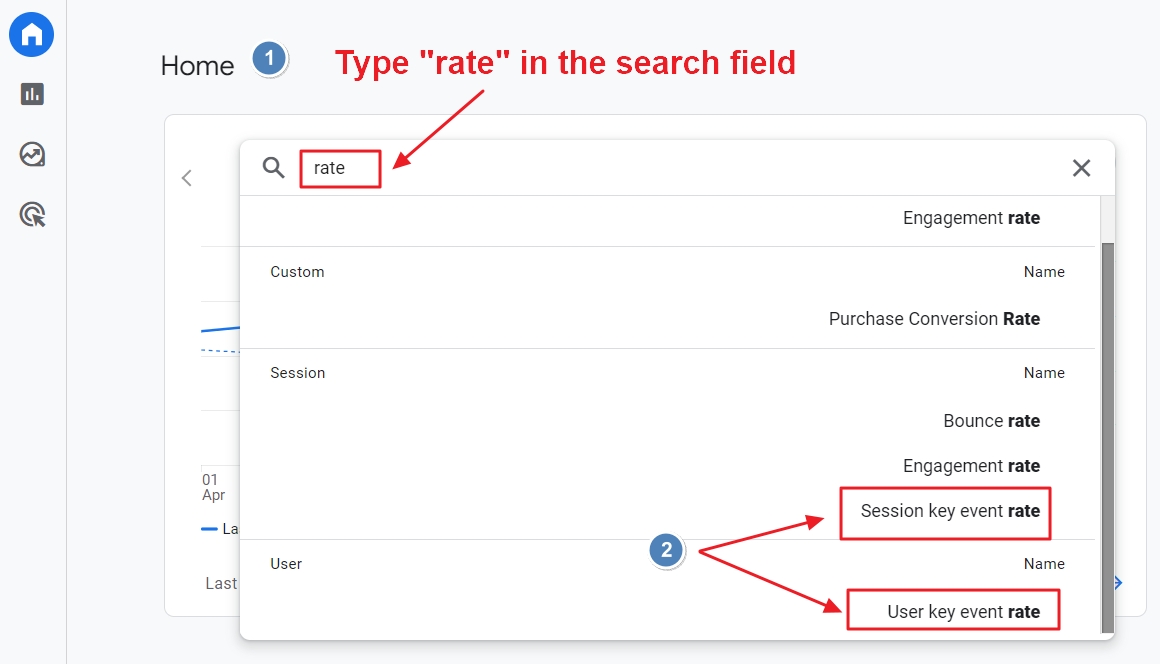
Type “rate” in the search field and select the user respectively, session key event rate.
Step 3: Compare the key event rate changes over time

The big key event rate percentages in black represent the data for the selected period. The colored percentages below them show the change in percentage compared to the previous period.
Increased rates are in green and have an arrow pointing upwards.
Decreased rates are marked in red and the arrow then points downwards.
If you change the period, you can quickly compare key event rates for a week, month, quarter or a year.
That’s it.
Jeff Sauer, the founder of DDU, calls this a “zoom out” analysis. It shows data for your complete site and for all the events you marked as key events.
Although that can be useful, it can also be misleading. If, for example, you have a site with thousands of pages, the key event rate will in most cases be lower than for sites with less pages.
And of course, the rates will be influenced by your choice of key events. If you marked, for example, page_view as a key event, the rates will as high as the sky.
Luckily, you can use these metrics for a zoomed in analysis too.
But before I get to that, let’s make sure you understand the difference between users and session key rates.
Why do user and session key rates in GA4 show different results?
In GA4, different user and session key event rates can show different numbers. This is not a bug.
Users and sessions are different things in GA4.
The same user can, for example, visit your site multiple times. Each visit is called a session.
To illustrate the difference, let’s assume that during one week your site
- had 10 users
- all of them visited your site twice (20 sessions in total)
- only one user triggered two key events within the same session
Put differently:
- Total Unique Users: 10
- Total Sessions: 20
- Sessions with a key event: 1
- Total key events: 2
GA4 does the calculation then as follows:
User key event rate: 10% -> (1/10)* 100%)
Session key event rate: 5% -> (1/20) * 100%)
Let’s take a closer look at each key event rate to determine which one is more valuable to you.
User key event rate in Google Analytics 4
The user key event rate in GA4 tells you the percentage of users that visited your site and triggered a key event. This is obviously information that is valuable for a business.
- If users do more valuable actions on your site than what you expected, it may be worth implementing it on other pages or campaigns.
- If they do less of these actions, you know what focus on. For example, you may want to change your copy, make a button stand out, use different images, and so on.
Even if only 0.5% of your total users trigger a key event, you have data to work with.
You can compete with yourself and look for ways to increase it to 0.75%, 1%, 1.5%, all the way up to the sky.
Session key event rate in Google Analytics 4
The GA4 session key event rate tells you the percentage of sessions that triggered a conversion. This can be useful in different ways.
If you run, for example, Facebook or Google ads, this metric is one of the powerful tools to evaluate the performance of your campaigns.
The session key event rate also helps you understand how many times users visit your site on average before triggering a key event.
Adding key event rate metrics to a GA4 report
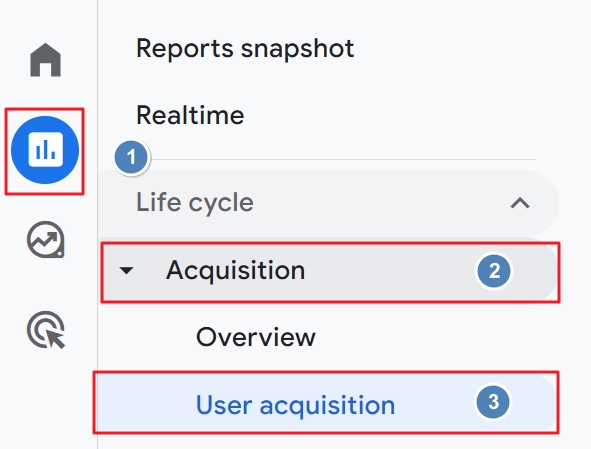
You can add the key event rate metric to GA4 reports, like the User Acquisition report.
To do so, open the report (Reports -> Acquisition > User Acquisition).
To customize your report, click the pencil icon at the right top corner of your screen.
Then, click the Metrics button.
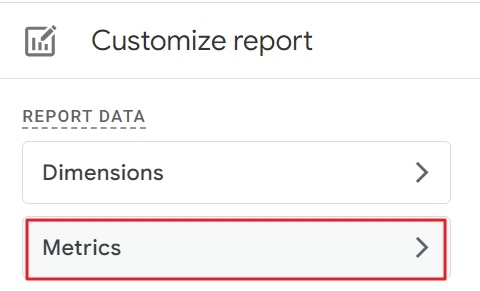
At the bottom of the screen, click Add Metric.
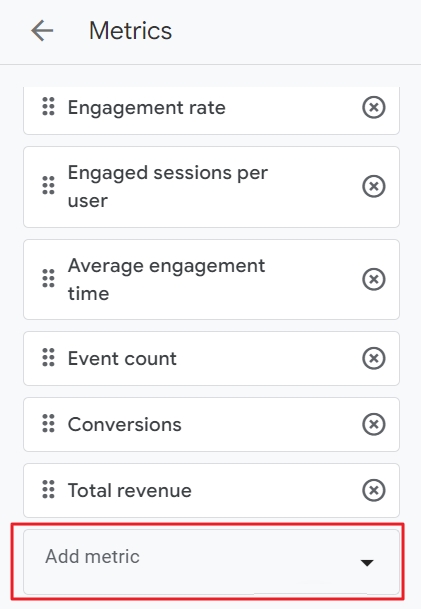
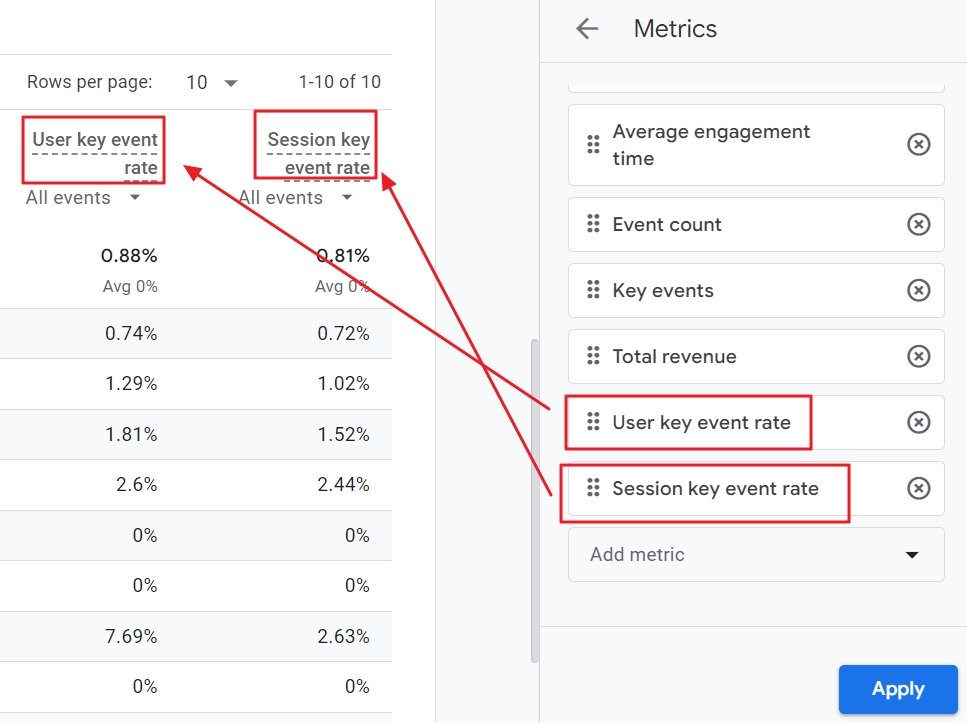
Use the search field to quickly find the key event rate you want to add to your report and click on it. Then click the blue Apply button.
The session and user key event rate are added to the table of your report, but you may need to scroll horizontally to see them.
Also note that the vertical order in which they appear in the data table is the same as the horizontal order in the customize metrics panel. So, the metric on the top appears first in the table.
To save your customized report, click the blue Save button at the top of your report. I highly recommend you choose “Save as new report”. This way, you won’t override the original built-in report.

Give it a descriptive name and optionally a description. This way, you and your team can later on easily understand the purpose of the report.
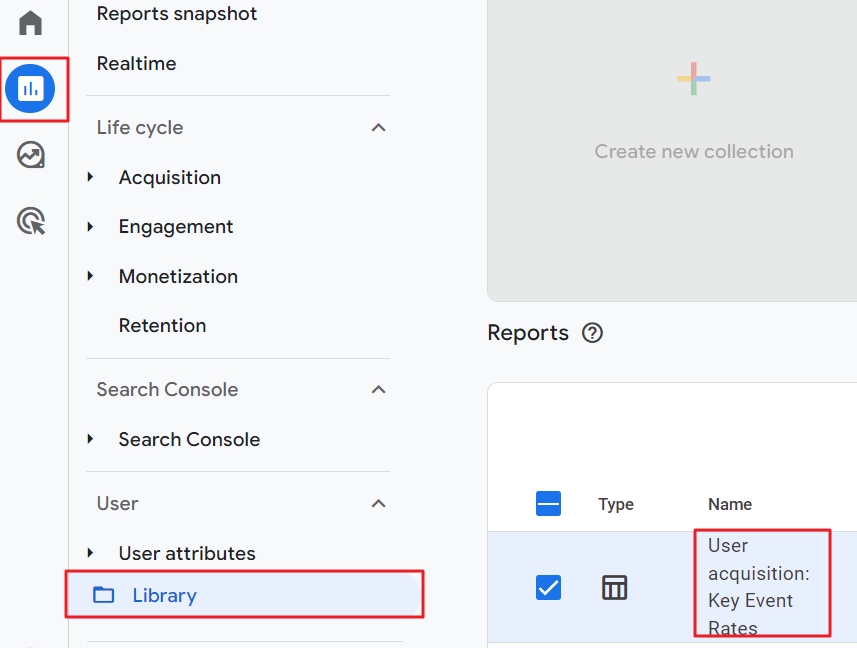
To access your report with the conversion metrics, go to the Library in the Reports section of your property and click on the report.
Then you can also add your GA4 custom report to a collection, which is just a strange name to call a navigation menu on the left.
Pro tip: you can add key event rate metrics to the GA4 landing page report or use it to build your own GA4 exploration report.
Final thoughts
I was shocked when Google changed the very definition of conversion rates into key event rates for all traffic that is not coming from Google Ads .
But if you take some distance, it makes somehow sense.
First, Google found a cheap and nifty trick to promote Google Ads. Splitting the traditional conversion rates into two sorts gives the impression that key event rates are to track small steps forward, whereas conversion rates show the big leaps forward.
Second, many businesses and even seasoned marketers are struggling with defining which metrics matter most. The name “key event rates” may change the way you think about conversions, FKA goals in the previous version of Google Analytics.
Finally, the digital marketing landscape is changing rapidly. Privacy regulations, the depreciation of third-party cookies, artificial intelligence and whatnot make it a lot harder to track users and to attract customers from traditional channels, like organic search.
Maybe getting rid of traditional marketing terms and strategies is not a bad thing.
Don’t cling to the past, but look ahead
This is exactly what we do at Data Driven U. We keep the finger on the marketing pulse and make +50K smart marketers like you stay informed with our free marketing newsletter.

