Google Analytics 4 doesn’t have site speed reports, unlike Universal Analytics. Since speed is a ranking signal in Google, the missing data feels like a step backwards. Every millisecond counts, so let’s hurry and find out how to get your speed metrics back…
Quick reminder why site speed metrics matter
When a web page is loading slowly, your visitors get frustrated and leave. If this is a structural situation, the page will drop in the Google results. Speed is namely one of the 3 elements of the so-called Core Web Vitals.
In brief, these are 3 Google metrics to give your pages a score for experience.
Slow web pages raise the blood pressure and kill the dopamine
If you have ever used GA4 explorations, you know what I’m talking about.
The fact that Google reveals that speed is an important ranking factor says a lot about how important it is. Many other factors are a secret ingredient of the search engine’s kitchen.
That leaves us with one big mystery…
Where are my speed reports in Google Analytics 4?
Currently, you cannot find speed reports in GA4. This may change since the product is still under development.
Jeff Sauer and the Data Driven U team have been following GA4 closely since it was announced. We would not be surprised if the speed report would suddenly show up.
Meanwhile, you can fill in the speed data gap with the help of… Google.
- Stick to Google Analytics (2 options)
- Use other Google products (3 options)
I will mention the pros and cons of every option, so you can quickly decide what works best for your organization.
2 ways to get your speed metrics in Google Analytics
You have 2 options to access speed metrics with Google Analytics. Let’s start with the lazy way.
#1 Use Universal Analytics speed reports
Universal Analytics is the most obvious alternative to fill in the data gap for the missing GA4 speed reports. It will keep collecting data until the 1st of July 2023.
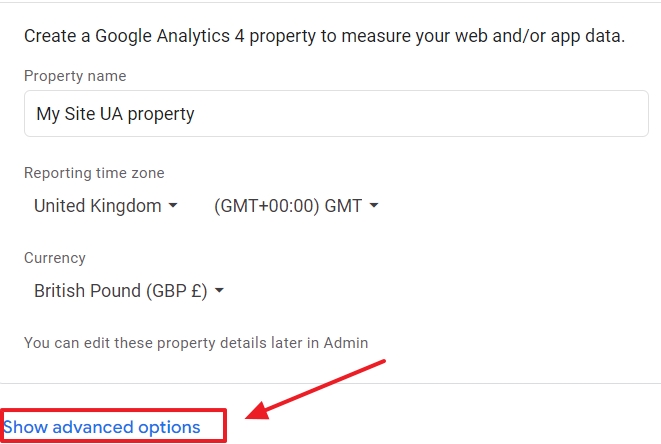
If you have created a fresh GA4 account, you can create a new property and, on the first screen click on Show advanced options.
Then, you change the slider to create both an UA and GA4 property.
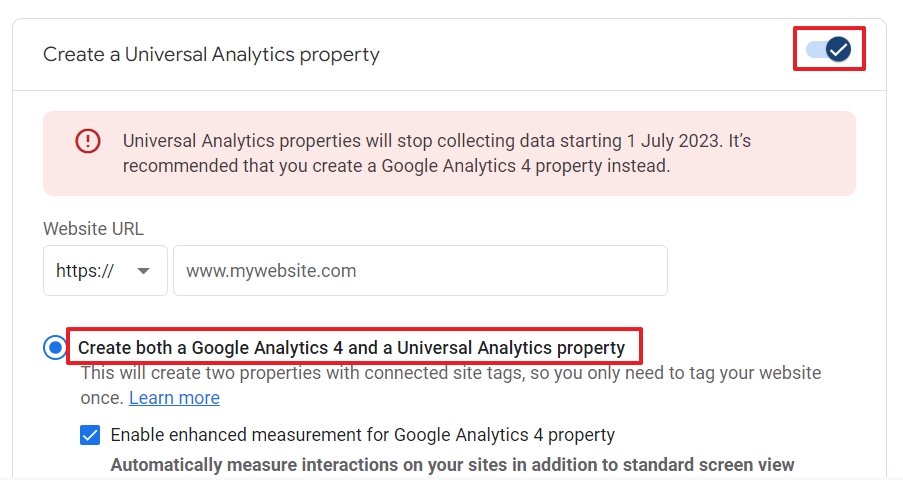
Since this is a temporary solution, ignore the warning.
This solution is ideal if you…
- have little resources or technical skills.
- have a small to medium site (<1K pages)
- don’t run an ecommerce site or a site in a competitive industry or niche.
- have already optimized your site (more or less) with a fast web host, plugins, compressed images and maybe even a CDN (Content Delivery Network) or static HTML pages.
- won’t need historical data about your site speed in GA4.
This is your fastest option, but UA speed reports have some downsides.
5 risks of relying on UA speed reports
1. The name Site Speed itself shows that UA was developed in another era. Page experience is more than speed.
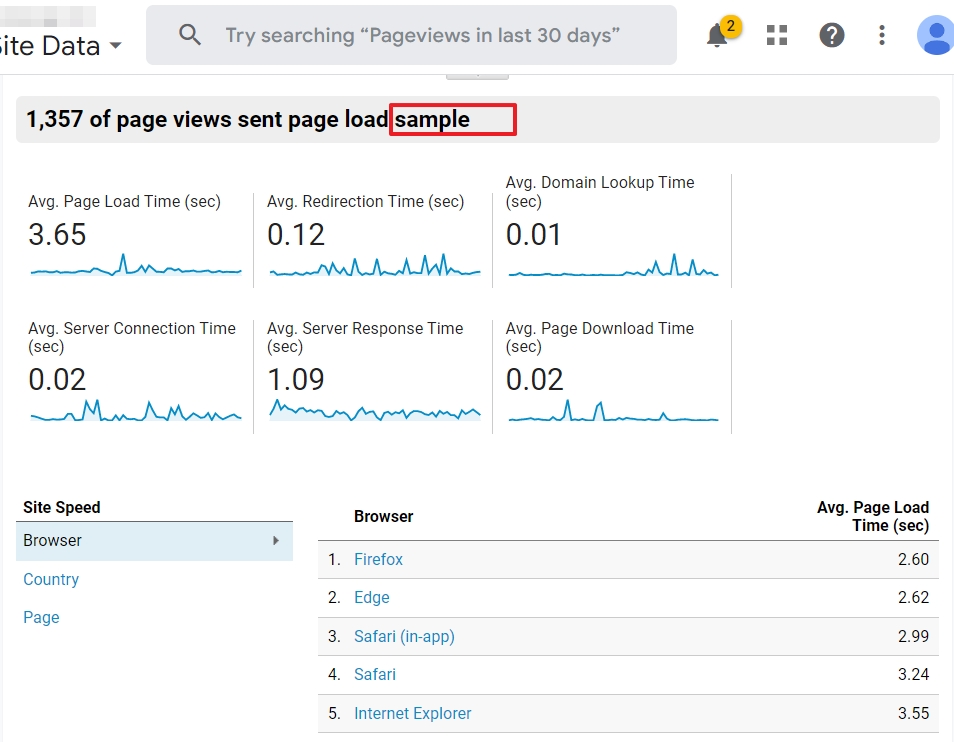
2. UA speed reports are based on a sample of 1% of your total pageviews. If you want a higher percentage, your developers can fix it this way.
3. Not all your web pages may appear in the speed metrics. There is a limit of 10K pageviews that is used for the sampled data.
4. UA collects data differently than GA4 does. Milliseconds are milliseconds, but visitors are visitors too and those numbers can vary in both GA versions.
5. UA contains average speed data of your website. Although that is handy, people do not visit websites. They visit pages.
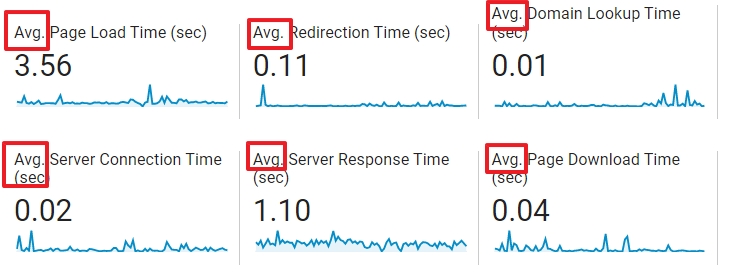
6. UA doesn’t contain Core Web Vital metrics.
To illustrate my point: this is the Speed Suggestions report in UA:
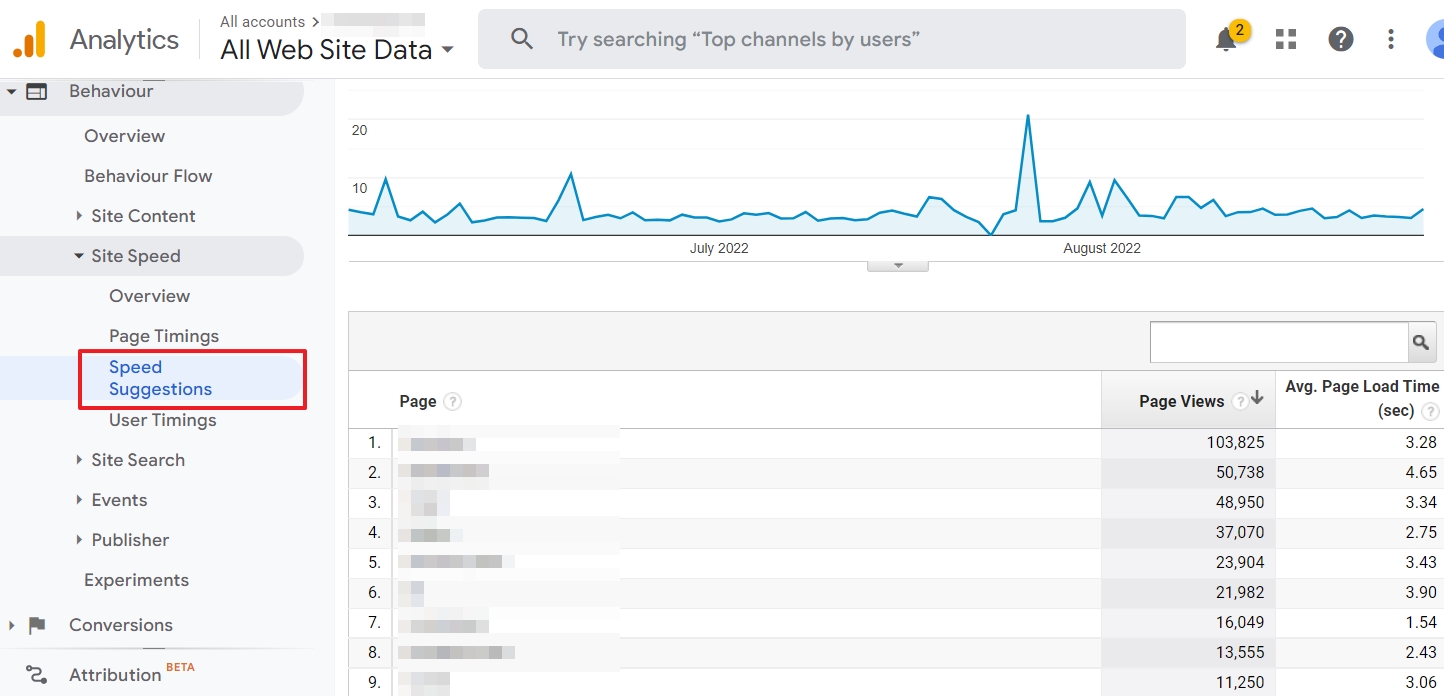
Do you see anything actionable over here?
#2 Web Vitals JavaScript and BigQuery
You can collect speed metrics in GA4 by adding JavaScript code to your site, send the data to GA4 with Google Tag Manager, export the data to BigQuery and load it in Data Studio.
That’s in a nutshell what you can do to fix the missing GA4 site speed report. The data won’t be visible in your reports, though. You can find all the technical information and instructions on Google web dev.
This alternative is ideal if you…
- have a development team or want to hire a developer.
- are in a hurry and want YoY speed data in GA4.
- run a big site or web shop.
- want to take advantage of the fact that BigQuery is free. Check our guide to connect it to GA4.
Nobody forces you to stick to GA.
Let’s look at 3 alternative ways Google offers you to analyze speed performance and detect bottlenecks.
3 Google tools to analyze page speed
Although having access to speed metrics in GA is convenient, it is not the only tool you can (and should) rely on. Google itself has some products you will find useful.
Although they may not satisfy your digital marketer hunger for data, these are great tools that can help you boost your efforts
You may have set up the perfect campaign, but a slow loading landing page can undo all your hard work.
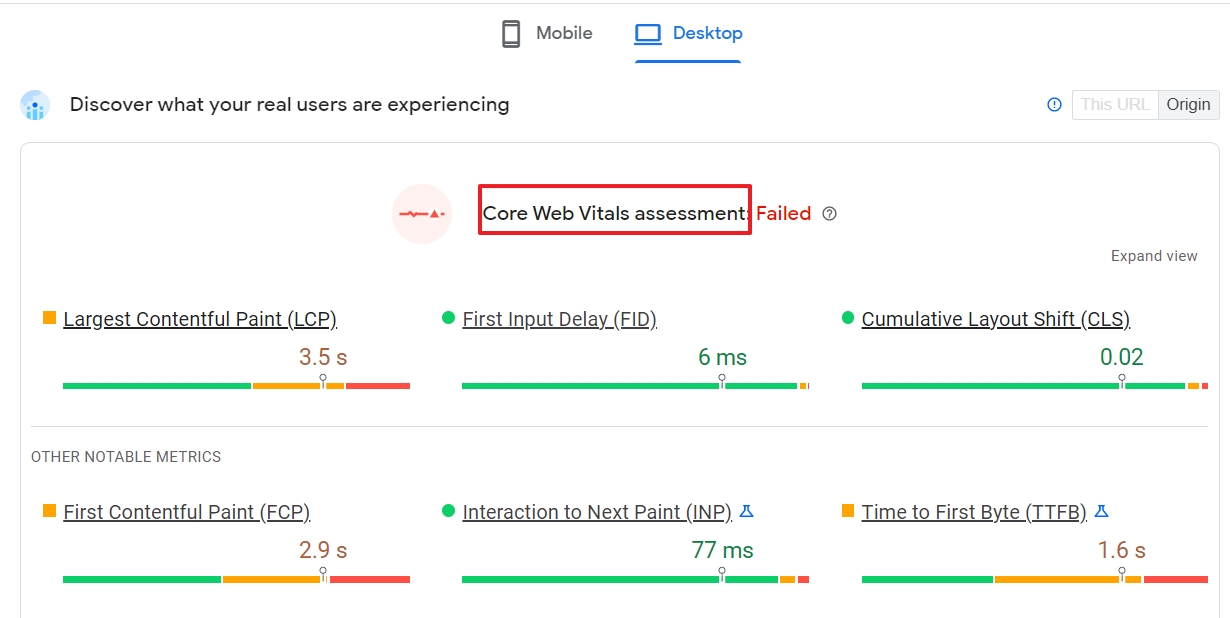
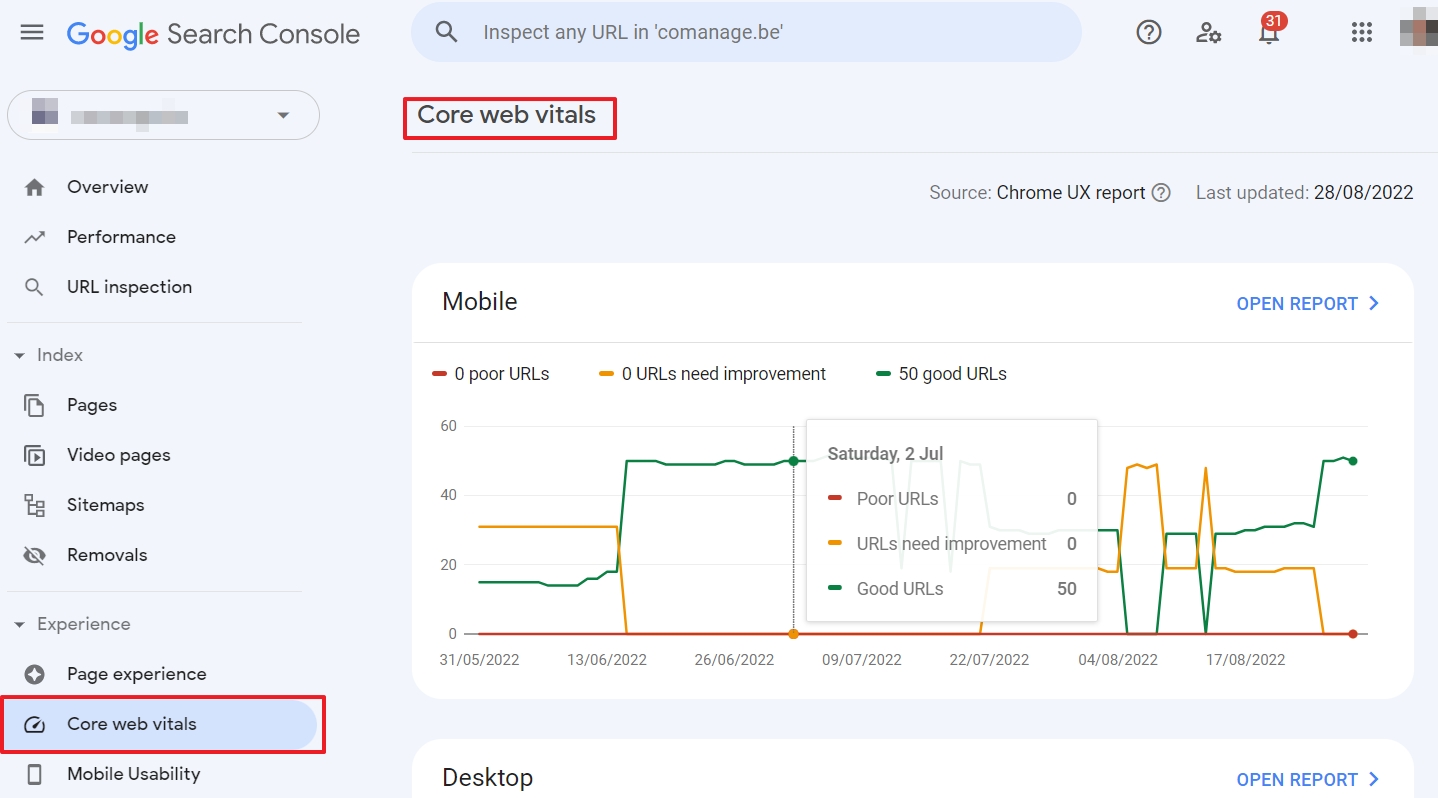
#1 Core Web Vitals reports in Google Search Console
GSC contains a section dedicated to Core Web Vitals. This gives you a general overview.
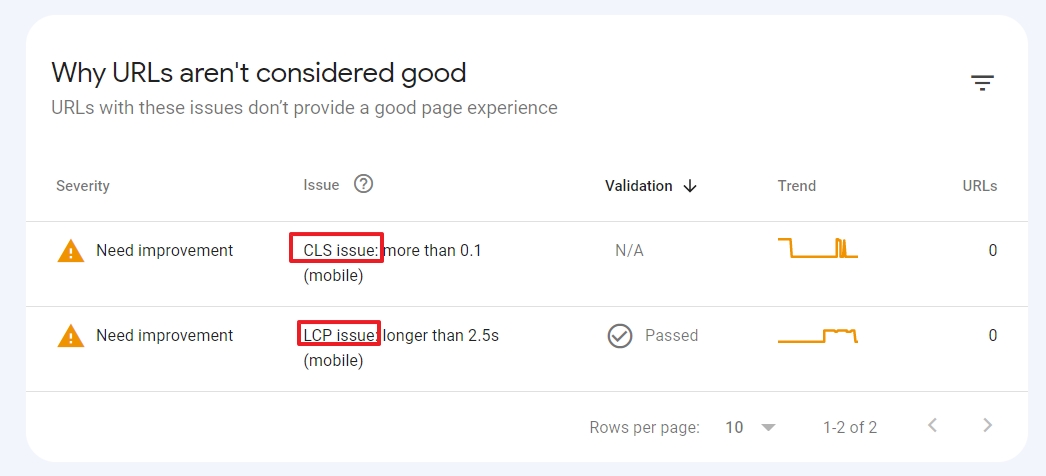
When you dive deeper into the reports, you can see the details of issues.
If you are not familiar with GSC, this article will help you understand the differences with GA.
Advantages
- The data is automatically collected for you in your GSC account.
- You get a better overall view of page experience. Your site may load lightning fast, but other elements can mess up the page experience. A pop-up on mobile, elements shifting on the page, etc.
- It’s a free tool and, unlike GA4, easy to get started with.
- The data is from real users.
Disadvantages
- Although you can connect GA and GSC, the CWV reports don’t appear in your GA account. This also implies that you cannot use the speed data with dimensions, as in UA.
- The data range is limited to the last 28 days. If you need more historical information, you will need to export your GSC reports. Clumsy? Yes.
- The data is from Chrome browser users only. People who visited your site with, for instance, Safari or Firefox, may have experienced a different loading speed in different ways.
- The data is sampled and will not reveal all speed issues your site and visitors may have suffered from.
#2 Page Speed Insights
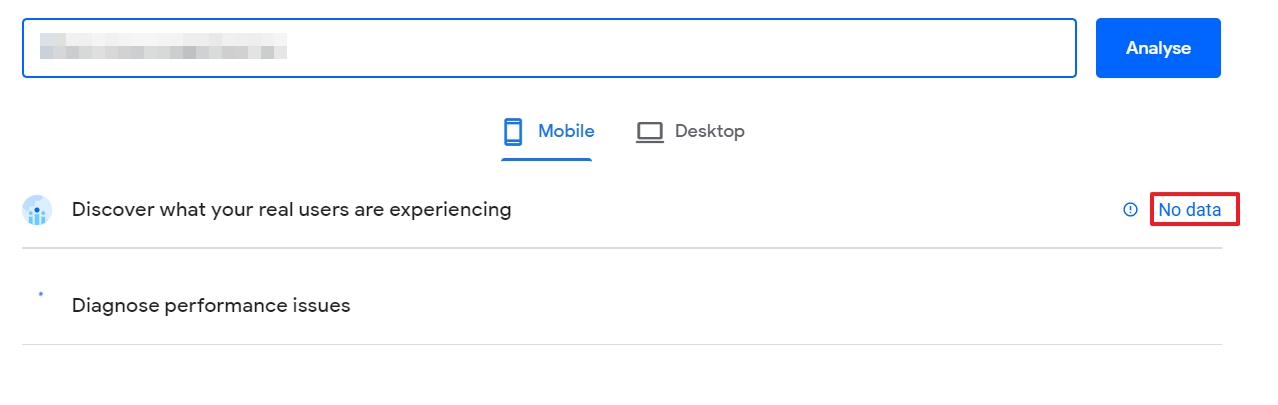
Page Speed Insights (PSI) is another product by Google to analyze speed performance.
Advantages:
- The tool is ideal if you want to analyze one page. For free.
- You don’t need to have a GSC account, which makes it easier to analyze the CWV metrics from web pages of customers, or competitors.
- The data can be from real users. Or it can be aggregated. Or there can simply be too little data from real Chrome browser visitors.
- PSI gives you technical suggestions that you can implement to improve Core Web Vitals.
- There is even a PSI api.
Disadvantages:
- The online version can only analyze one page at a time.
- PSI gives you a lot more information than you can find in UA speed reports.
- You cannot configure important parameters that can highly influence the experience for real users, such as network type, location.
- The results may vary. If you run the test twice, you will see different scores.
If you want to analyze the speed for different smartphone models, the next tool can help you.
#3 Lighthouse in Chrome
You can access Lighthouse in the Chrome developer tools.
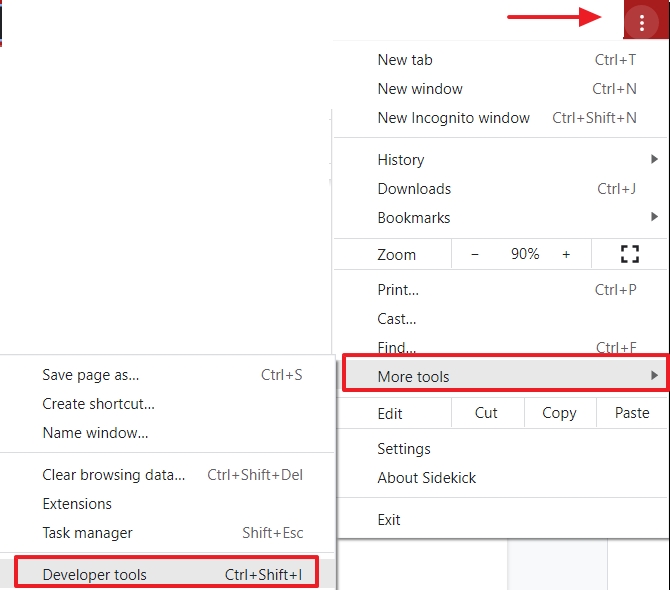
Click on the 3 dots in the top left corner of Chrome.
Then go to More tools > Developer tools.
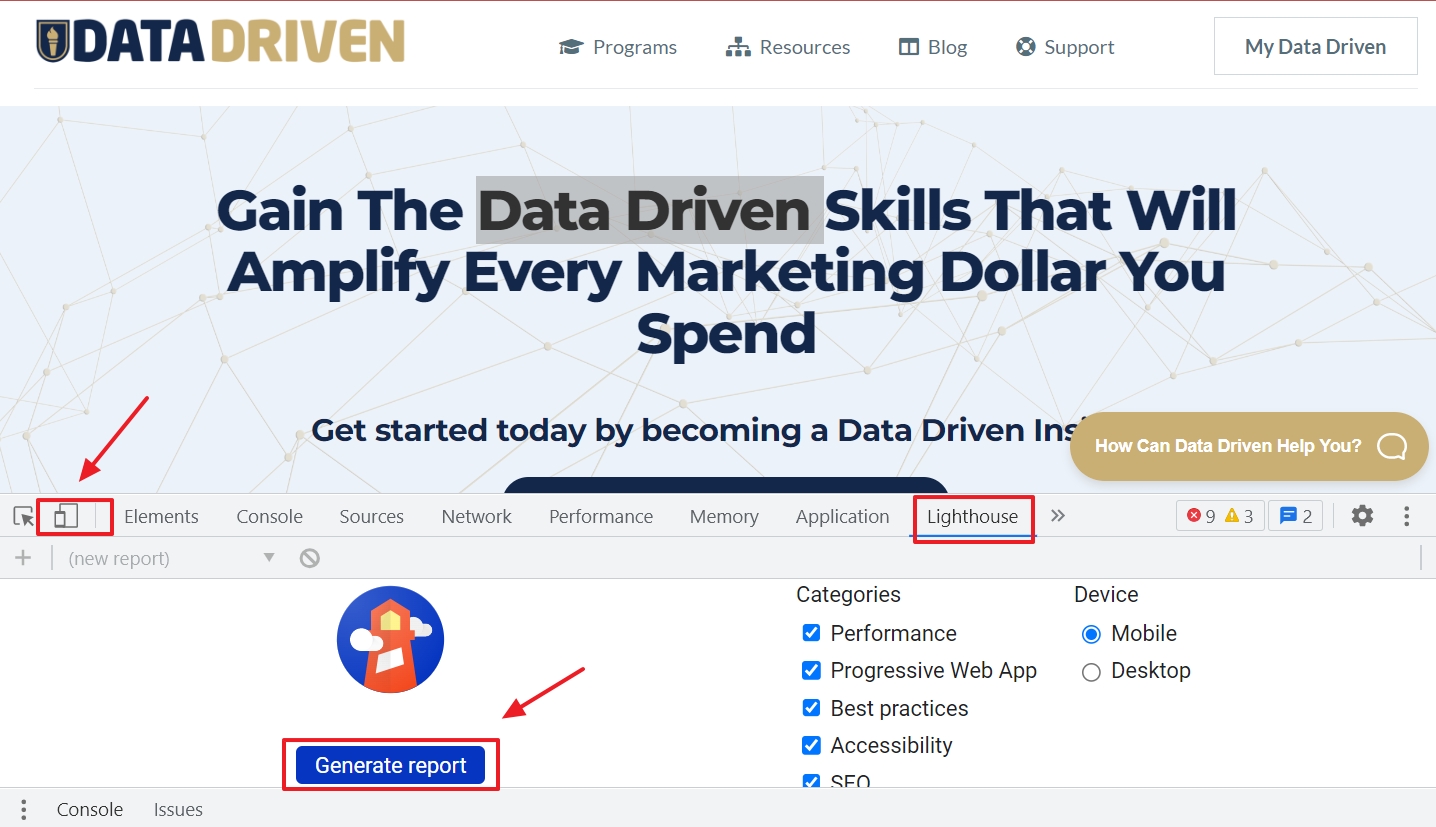
Open the Lighthouse tab.
You can select some options, such as the desktop or mobile version of your site. On the left, you can change the device type.
Then click on Generate report.
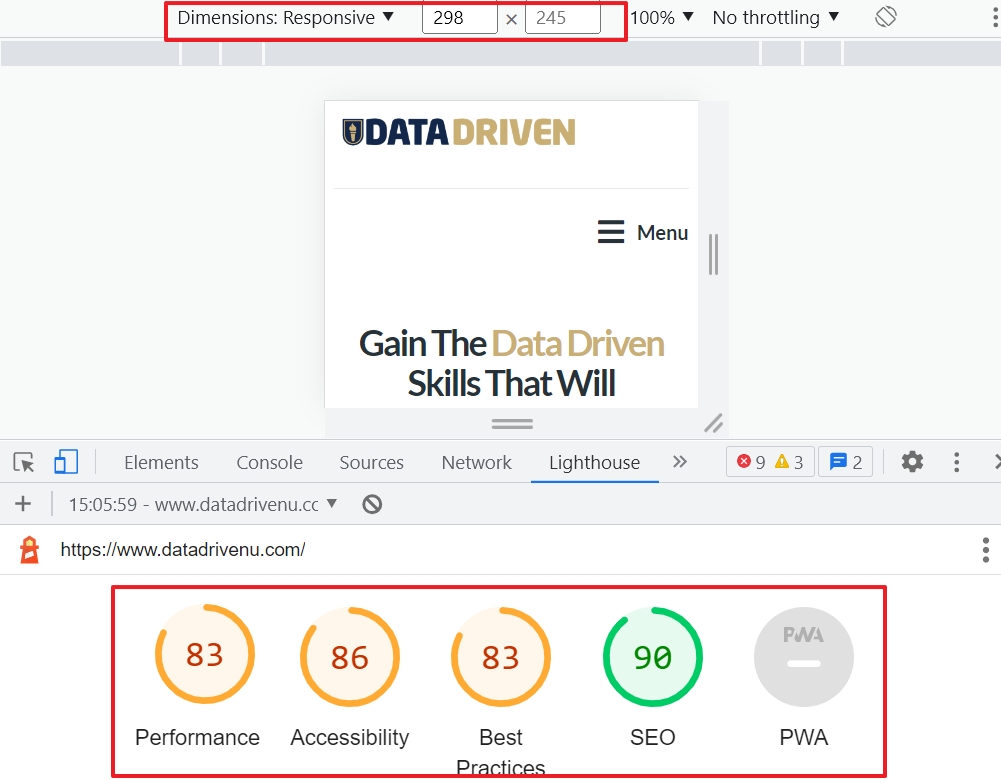
And then your Lighthouse report shows up.
Advantages
- You can configure the type of devices.
- You don’t need to install anything. It works out of the box in the Chrome browser.
- You get a lot more insights than just speed metrics.
Disadvantages
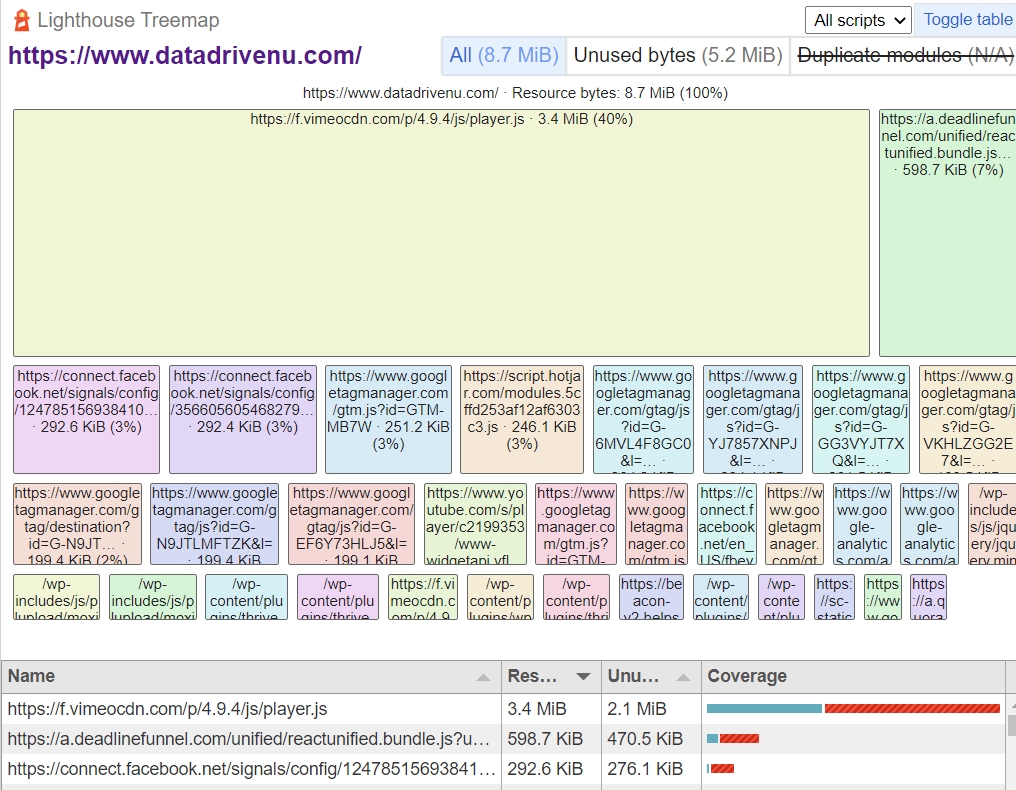
- This is a tool for developers. It even contains a treemap that shows you the biggest sources of delay.
- You can only analyze one page at a time.
- You can store data but locally on your computer.
- There is a Chrome browser extension, but it is for developers.
- You can only analyze desktop or mobile at once.
- The results for the same page vary when you generate the report multiple times.
That was it. I showed you 2 ways in GA and 3 tools that can hopefully ease the pain of the lost GA4 speed reports.
Before you rush away, let me quickly summarize the above.
Key takeaways
- Google Analytics 4 doesn’t have site speed reports. Yet. This can change.
- Meanwhile, you can still use the speed reports of Universal Analytics, but interpret the data cautiously.
- You can collect speed metrics with GA4 and BigQuery, if you have the technical resources or skills.
- There are other Google products to analyze page speed for free.
- Google Search Console keeps your historical speed data for only 28 days.
- Page Speed Insights and Lighthouse are tools for developers, but marketers can use them too to quickly analyze the loading performance of landing pages.
- Speed is only one of the Core Web Vitals that gives you an idea about page experience.
- Speed is a ranking factor in Google, and therefore, you need to regularly check your metrics.
On behalf of the Data Driven U team, thank you for your precious time! I hope the information will help you create a good experience on your site.